/

March 21, 2019

Precision viticulture with AI and drones: maximize quality and yield with cutting-edge models

Precision viticulture

Precision viticulture with AI and drones: maximize quality and yield with cutting-edge models

Read this article to learn how you can enhance your performance in precision viticulture with AI and drones. Use a smart combination of AI and drone imagery to improve both the vine quality and the work on the ground.

Precision viticulture with AI and drones: The vineyard case

Grapevines have been part of agricultural strategies for millenniums. They represent today a total surface of more than 7 million hectares across the globe. Compared to other fruits, grapevines are particularly disease-prone and sensitive to weather and soil conditions. Winegrowers care through the season about the quality of their fruits and are looking to get the right quantities for their wine production.  Note that not necessarily the more the better.

The monitoring of each individual vine is complex for wine owners and vineyard workers. Vines evolve quickly throughout the growing season and it is difficult to compare them over large domains. Winegrowers need to spot locations where things are going wrong: growing anomalies, potential disease outbreak or lack of nutrients such as nitrogen, phosphorus, or potassium. Additionally, winegrowers need to quickly localize and assess damages when natural hazards such as hail occur. They can then establish proper reinsurance claims when knowing the vines are damaged. Moreover, they can forecast production losses more precisely and plan in advance mitigation measures.

The iron eagle eye point of view

When it comes to very large domains, it becomes very difficult to have a streamlined, fixed, and consistent assessment of the status of the vines, vine per vine. This is where unmanned aerial vehicles enter the field. These small fixed-wing airplanes or multicopters, which usually fit in a suitcase and are carried by one person alone, are changing the game.

Orthomosaic over a vineyard parcel from drone images acquired by Phytodrone.

Drones allow getting images that provide a clear overview picture of the domain. But they really unleash their power when we apply image processing and machine learning techniques. This allows getting richer information and details. For example, it becomes easy to spot where vigor is higher than desired. Such a zone can then be removed from a fertilizer program. Also, the localization of dead, damaged, or simply missing vines can be done automatically. This enables the organization of next year’s replanting work.

Often vineyards have ground sensors measuring temperature, soil moisture or nitrogen content. However, it is often difficult to interpret these punctual measures.  Meanwhile, the aerial images provide a complete view of the parcel. Based on both the in-situ measures and the aerial images, the winegrower can start to fully investigate the dynamics present in a parcel.

How to get the optimal images?

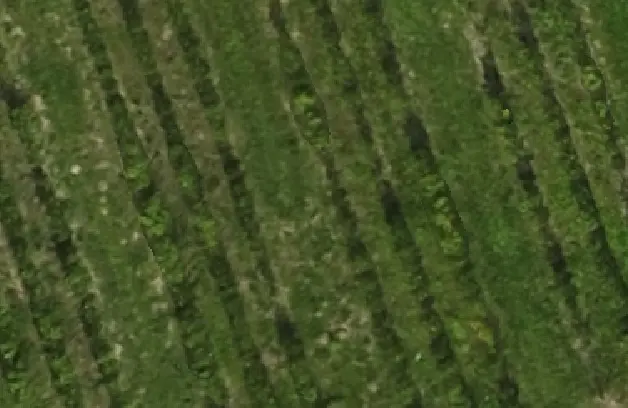
The acquired imagery needs to be of quality in order to ensure optimal outputs for the analysis. The ideal resolution ranges from a few cm (~2-3) up to 10cm. Early in the season when the leaves are still small, a higher resolution of a few cm will be needed. Later on, when the canopy has fully developed a resolution between 5cm and 10cm may be sufficient. In our previous blog post on the topic “Vineyard monitoring right into your laptop!” we presented some visual examples of different resolutions over vineyards.

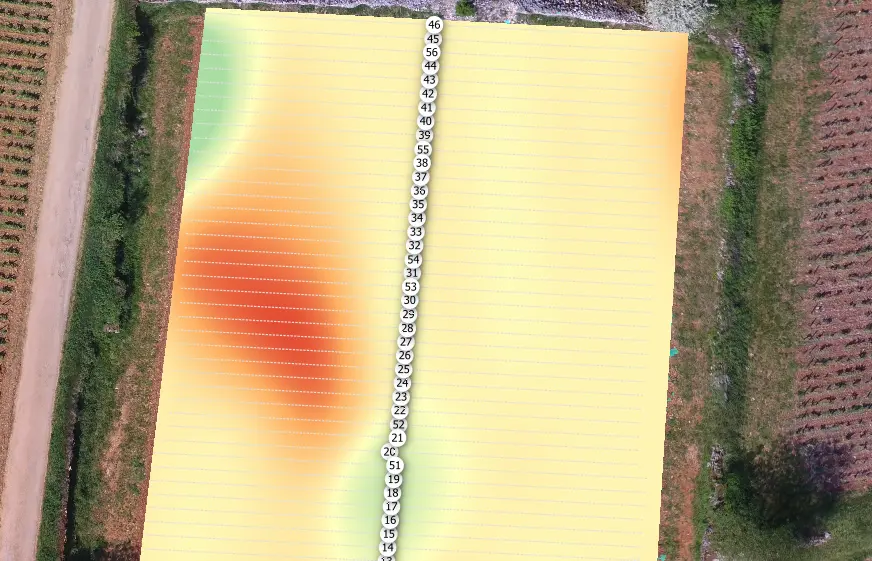
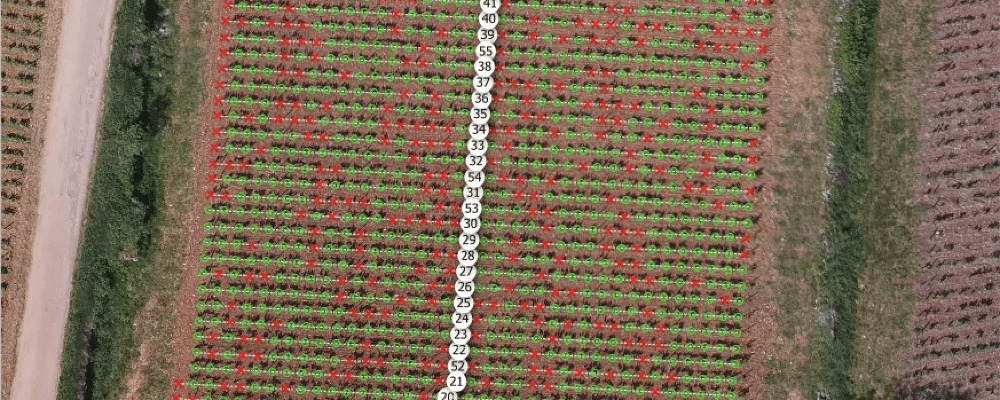
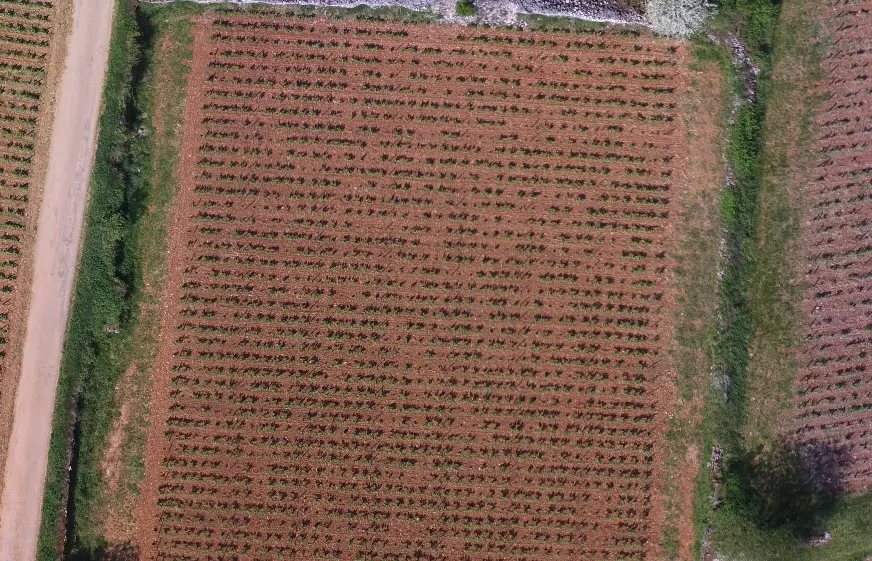
One needs to be careful with respect to the overlap between images required along and across flight tracks. Typically for vegetation, we need high image overlaps in order to ensure a proper 3d reconstruction. However, in this particular situation with small plants in rows, a precise 3d reconstruction might bring undesired artifacts during the orthorectification. This is due to the Digital Surface Model (DSM) which is simplified and produces edges not corresponding to the vine leaves. Moreover, the reconstruction might not have been effective everywhere generating blobs in the DSM over parts of the vine rows. Those artifacts can be seen in the orthomosaic below.

The presence of artifacts from the orthorectification process results in sharp edges which do not fit precisely with the vine leaves.

You can attenuate artifacts by smoothing more the DSM used for orthorectification. This will preserve better the vine visual patterns at the expense of a less accurate orthorectified mosaic.

Once you have the right data, the next step is analyzing it.

Precision viticulture with AI and drones: The Picterra approach

1. DIY: Get the canopy cover yourself

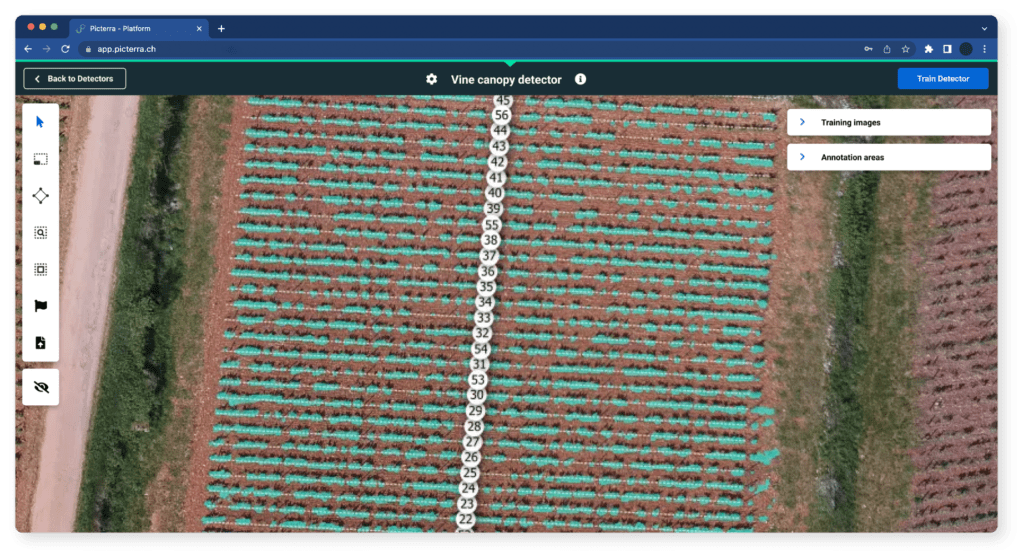
The first step is to detect all the vine canopy. This allows eliminating disturbing information such as Build my detector inter-row grass or ground, paths, stones, etc. You can perform the detection of the canopy directly into the Picterra platform (https://app.picterra.ch) by building a new detector of the vine canopy.

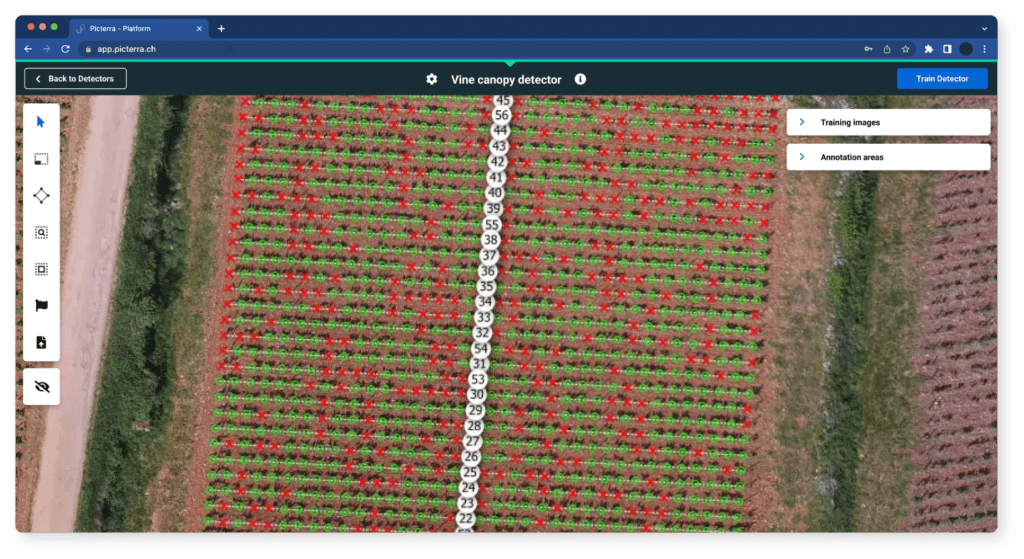
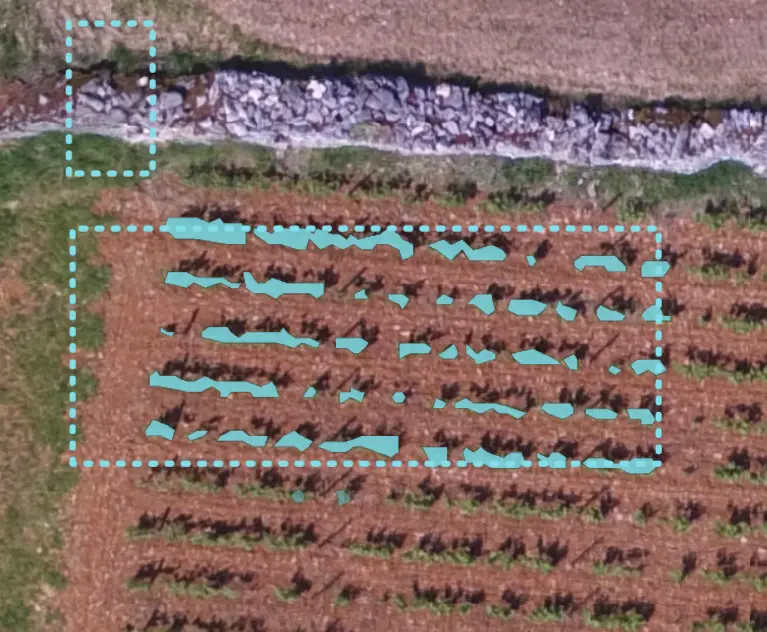
You should define training areas over several vineyard rows and at least a part of the background outside the parcel. This allows discriminating grass from vines. Then you need to entirely outline the vine canopy with polygons inside the training area(s).

Finally, you can build the detector and run it over the orthomosaic to detect all the vine canopy cover.

2. Extraction of vine rows and missing vines

Based on the canopy cover previously obtained we can, thanks to our dedicated processing chain for viticulture, derive the position of the vine rows. The vine rows, represented as lines, provide you directly with information such as the length of the row and the percentage of vine canopy occupancy.

Vine canopy detected along the vine rows.

Then we can detect the missing vines and obtain statistics related to each row: the number of vines, missing vines, the linear density of the row, or the occupancy percentage.

Vines (green) and missing vines (red) for each vine row.

The parcel number and percentage of missing vines allows to prioritize and estimate the replanting work for next season. Here are the statistics for this parcel:

3. Analysis of the vine vigor

The interest in detecting the vine rows and the vine plants is in focusing on the extraction of information. One major flaw of vineyard analysis from drone imagery is the disturbances made by non-vine elements. For example, when looking at the vigor of a parcel (e.g. NDVI index) it is difficult to visually separate contributions from inter-row grass, missing vines, or actual vines. Excluding these disturbances from the analysis is extremely crucial when analyzing large areas. In order to produce readable information, we extract the vigor only from the vines. We then interpolate this information over the entire parcel. This produces a colored map where zones with lower vigor can be spotted immediately. We aim at providing an efficient workflow making the relevant information available to vineyard experts. Making prioritization of work focused in-depth analysis, and overall decision easier.

Interpolated map of vine vigor extracted from NDVI on the vines only. Red shows lower vigor zones while green has higher vigor zones.

Precision viticulture with AI and drones:

You can now explore this project directly on the Picterra platform.

You can download the outputs (image and vector layer) here.

Do you need a Specialized Vineyard Analysis?

Want to learn more?

sign up to our newsletter