Satellite imagery sources: The Basics
Before starting to download satellite imagery, it is helpful to know a few basic concepts about Earth Observation satellites and the data that they collect. One practical reason is that most download sites will ask you to choose various parameters to narrow your search of all the available imagery.
Orbits
Satellites orbiting Earth at different altitudes provide different perspectives, some always focused on the same area while others are constantly circling our planet. There are essentially three types of Earth orbits:
- low Earth orbit (LEO, 160 km to 2,000 km), which is used by most scientific and commercial satellites,
- medium Earth orbit (MEO, 2,000 km to 35,780 km), which is used by navigation satellites and those designed to monitor a particular region and,
- high Earth orbit (HEO, ≥ 35,780 km), which is used by many weather satellites and some communications ones.
A satellite’s orbital height determines how long it will take to orbit, because its motion is mostly controlled by Earth’s gravity: the lower it is, the stronger the gravitational force on it and, therefore, the greater its speed. One orbit can take from as little as a couple of hours to as much as 24 hours. (Our planet’s natural satellite, the Moon, which is 384,403 kilometers from Earth’s center, completes each orbit in 28 days.) In addition to height, an orbit also has two other parameters: eccentricity, which describes its deviation from a perfect circle, and inclination, which is its angle in relation to Earth’s equator.
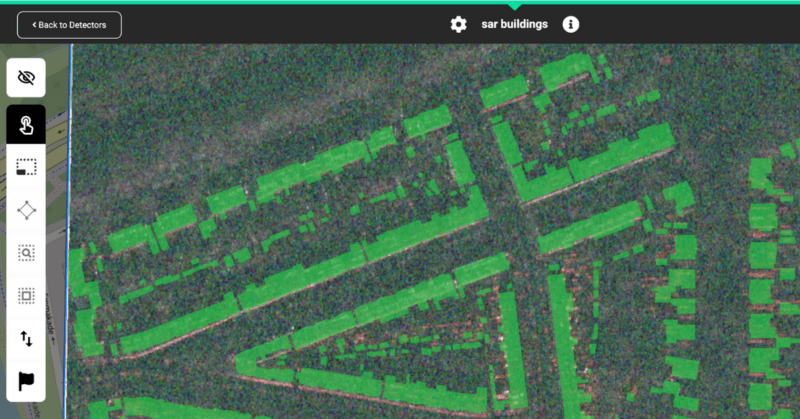
SAR imagery is what many in the geospatial world consider the cutting edge of earth observation imagery and with its ability to see through clouds and in the dark it has massive but yet undiscovered potential, especially for monitoring and alerting applications. Picterra is working to push the bounds of the industry to make this data both more readily available and actionable.

Satellite imagery sources: Where to Start
If you are not already familiar with the world of EO imagery, you might want to start by comparing free Landsat, MODIS, and Sentinel imagery with sample high-resolution imagery from Maxar. Landsat, a joint program between NASA and the U.S. Geological Survey (USGS) that has been in existence for more than 40 years, provides the longest available continuous space-based record of Earth’s land. It images Earth once every 16 days. The latest satellite in the mission, Landsat-8, was launched in 2013, and is currently the second highest resolution available for free for optical data. NASA’s MODIS constellation images Earth every one to two days and the Sentinel satellites, operated by the European Space Agency (ESA), do so every two to three days. Maxar owns and operates the WorldView-1, WorldView-2, WorldView-3, and GeoEye-1 satellites. They all have sub-meter resolution; WorldView-3 has a resolution of 0.3 m, which is the best commercially available.
Next, you will need to determine which factors matter the most for your intended use of EO imagery. Obviously, you need a source that has coverage of your area(s) of interest (AOI). Beyond that, you will need to be able to answer the following questions:
- What spatial resolution do you need?
- Is natural color (which measures the visible spectrum) fine for your purposes or do you need other spectral bands to reveal features or phenomena otherwise invisible?
- Will you be content with downloading imagery already processed by the provider or will you need to access the raw image files?
- How frequently will you need to have a fresh look at your AOI?
- What is your budget?
- Will you need the right to sell the imagery or use it in any other commercial way?
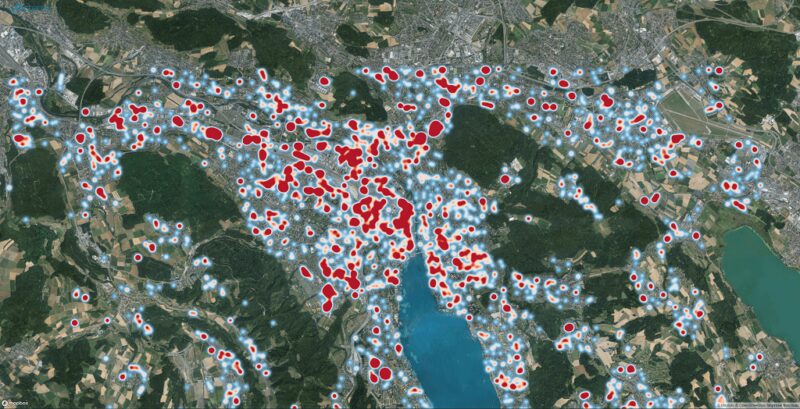
A heatmap showing solar panels detected over Zurich, Switzerland
Here are a few important considerations:
- Free satellite data is typically at low resolution (you can detect buildings but not cars) or dated (from a couple of months to a couple of years), while near real-time satellite data at high resolution is usually available for free only for humanitarian reasons, such as through Maxar’s Open Data program.
- Real-time, high-resolution data is still only a Hollywood fiction and near real-time high-resolution data still takes, in most cases, a few days. However, due to recent advances in automating the capture and distribution of EO data—such as in-flight pre-processing, cloud storage, and automatic ordering—the lag between scene capture and data transfer may soon drop to minutes.
- The imagery you see on Google Earth at the highest zoom level is aerial photography, not satellite imagery.
- Obtaining pricing information requires lengthy conversations—and, often, negotiations—with a sales representative.
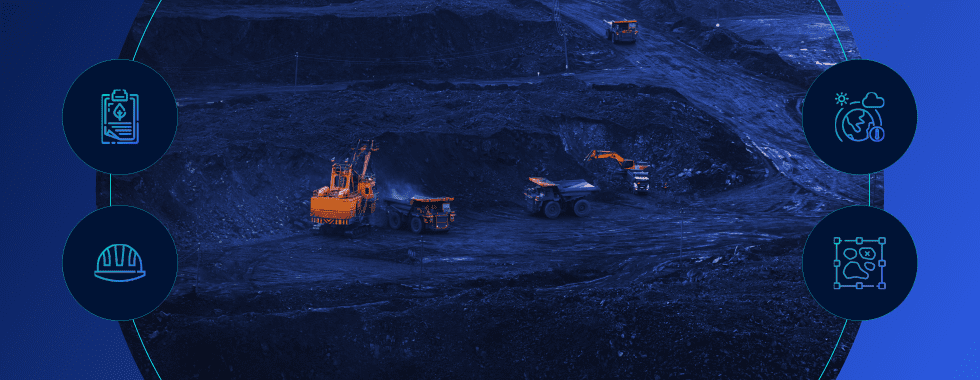
How can satellite imagery help your business?
All of the abovementioned rapid changes in the satellite marketplace made it possible to open entirely new business opportunities. Earth Observation data is widely used in crucial industries, including transportation, civil engineering, finance & insurance, real estate, energy, land administration and mapping, agriculture, humanitarian aid, and more. Check our Industry Pages for real-life examples.
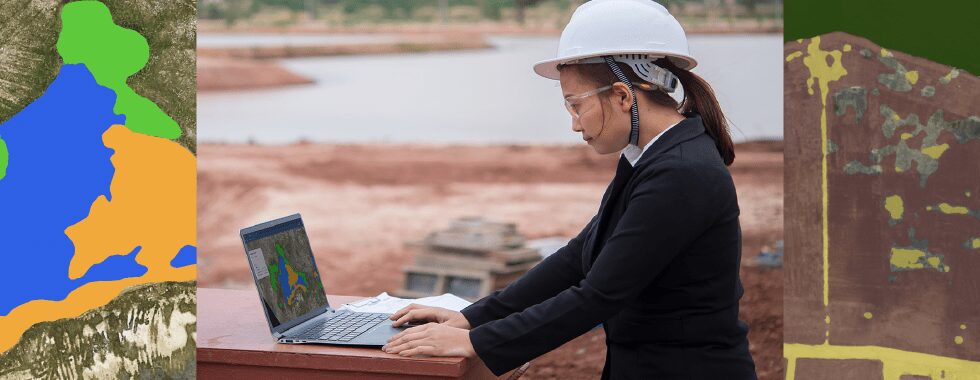
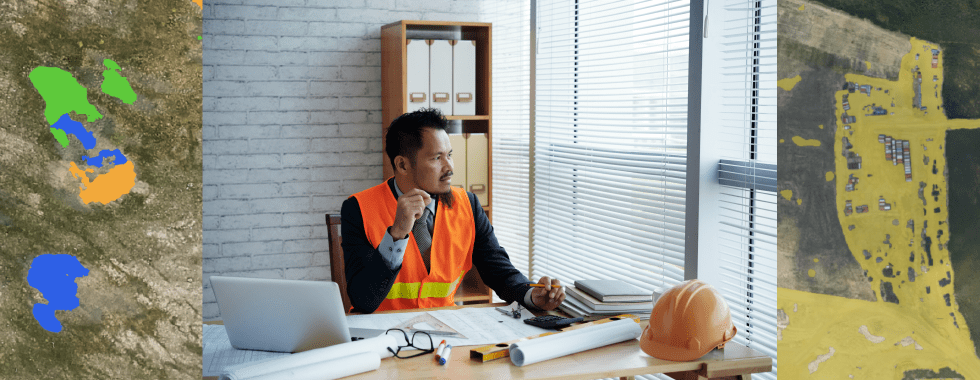
At the same time, it is important to know that accessing data and extracting actionable insights from it, typically requires a lot of time and expensive data science resources. Luckily, there are products that aim for democratizing access to geospatial data and insights, and Picterra is one of them. Picterra is a self-service SaaS platform allowing anyone to create, train, and run detectors on satellite and aerial imagery. It has an optimized human-machine interaction, access to imagery, and a large library of pre-trained detectors, without large upfront costs. We facilitate access to open-source satellite data (check our Imagery page for more details) but also high-resolution commercial satellite sources thanks to our partnership with SkyWatch.
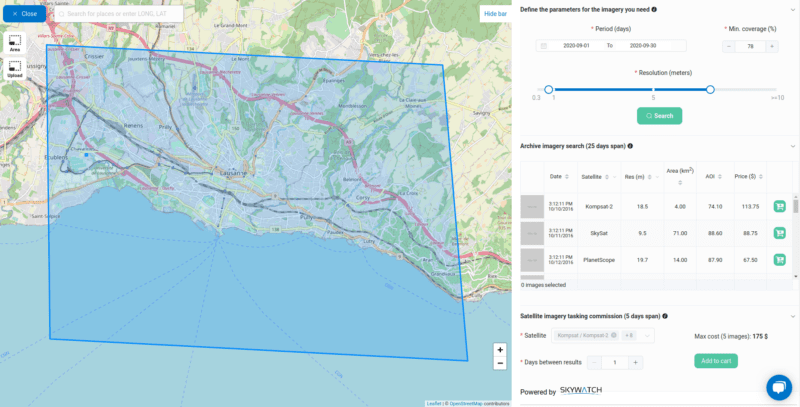
Picterra lets you order archive satellite imagery and task a satellite for monitoring purposes without leaving the platform.
One of the things that has been very difficult to achieve is this ability to easily and affordably access satellite data in a way that is fast but also in a way in which you can derive the insights you need for your particular business, James Slifierz, SkyWatch CEO told SpaceNews. What if you can merge both the accessibility of this data with an ease of developing and applying intelligence to the data so that any company in the world could have the tools to derive insights?