You can use any drone to capture your images: we support orthophotos coming from all the major photogrammetry software.
Ideally all the uploaded images should be georeferenced 8-bit RGBA geotiff (.tiff). This allows to exploit RGB color mosaics but also false color near-infrared images, thermal infrared images or digital surface models in the appropriate rasterized format (8-bit geotiff).
Other types of images are also supported (.png, .jpg, multispectral, single band, 16 or 32 bits) but will have to be normalized in order to be displayed and relevant information could be degraded or lost in the process. To best handle multispectral images (with more than 3 channels), find out more at this page.
Our platform supports 16-bit imagery for upload and visualization purposes. However, for machine learning (ML) workflows, 16-bit images are converted to 8-bit before processing. This conversion is necessary because our ML models primarily operate with uint8 data, ensuring consistency and compatibility within our existing pipelines. The higher dynamic range of 16-bit images can be uploaded and visualized, but the backend ML operations use 8-bit data for training and inference.
The conversion from 16-bit to 8-bit is designed to maintain helpful information, particularly by appropriately tuning the min and max ranges using our histogram tools. In most cases, 16-bit imagery contains a limited dynamic range within the full 65,536 possible values, and proper tuning during conversion allows for retaining essential details. This ensures that the resulting 8-bit imagery remains effective for model training and inference.
Yes, you can upload a raster with the surface or terrain information. However, you need to be careful with the normalization and ideally work with Height information in 8-bit format.
If you would like further information on how to best use your DSM or DTM to improve the results of your detectors you can check this article.
Picterra does not process raw drone images. The best way is to use a photogrammetry software to produce an orthophoto from your images (“stitching”) and then upload the ortho.
If you upload individual drone images (e.g JPG), they will be considered as non georeferenced imagery.
You can georeference them manually using a GIS software and reference points from either another georeferenced raster or ground control points.
Here you will find documentation on how to georeference your image with QGIS using its georeferencing plugin.
Picterra can support non-georeferenced images (e.g. .jpg, .png), however the platform is optimized for geo-referenced orthomosaics. As explained further below, if you upload image without georeferencing, the platform will arbitrarily geolocalize it at the (0,0) location, also called the “Null island” with an arbitrary resolution set to 10cm.
This means that when you run a detector on the image, you will get back latitude/longitude coordinates around this point zero. Our python client library exposes a function to convert the detector output back into image pixel coordinates. We will walk through its usage in this notebook.
Unfortunately you won’t be able to access any of the Picterra features when you don’t have an active subscription with Picterra. However, your data will be available and stored (for no more than 60 days after the termination of your subscription). If you need access to your data after termination, we strongly recommend downloading the information prior to your termination.
No, we have multiple users working with centimeter or sub-centimeter GSD.
The maximum image size is 100 GB (Enterprise plan) and 225’000 MP.
This can be either because your image is not georeferenced or because the georeferencing information is not recognized.
If your image is not georeferenced
If your imagery is not already a georeferenced orthomosaic or image, you can georeference it manually using a GIS software and reference points from either another georeferenced raster or ground control points.
Here you will find documentation on how to georeference your image with QGIS using its georeferencing plugin.
If you want to proceed still without georeferencing, the platform will arbitrarily geolocalize it at the (0,0) location, also called the “Null island” with an arbitrary resolution set to 10cm. This allows then to work with this imagery on the platform “as if” it was localized. Beware that if then you download the image from the platform, you will get the one geolocalized by ourselves arbitrarily at (0,0).
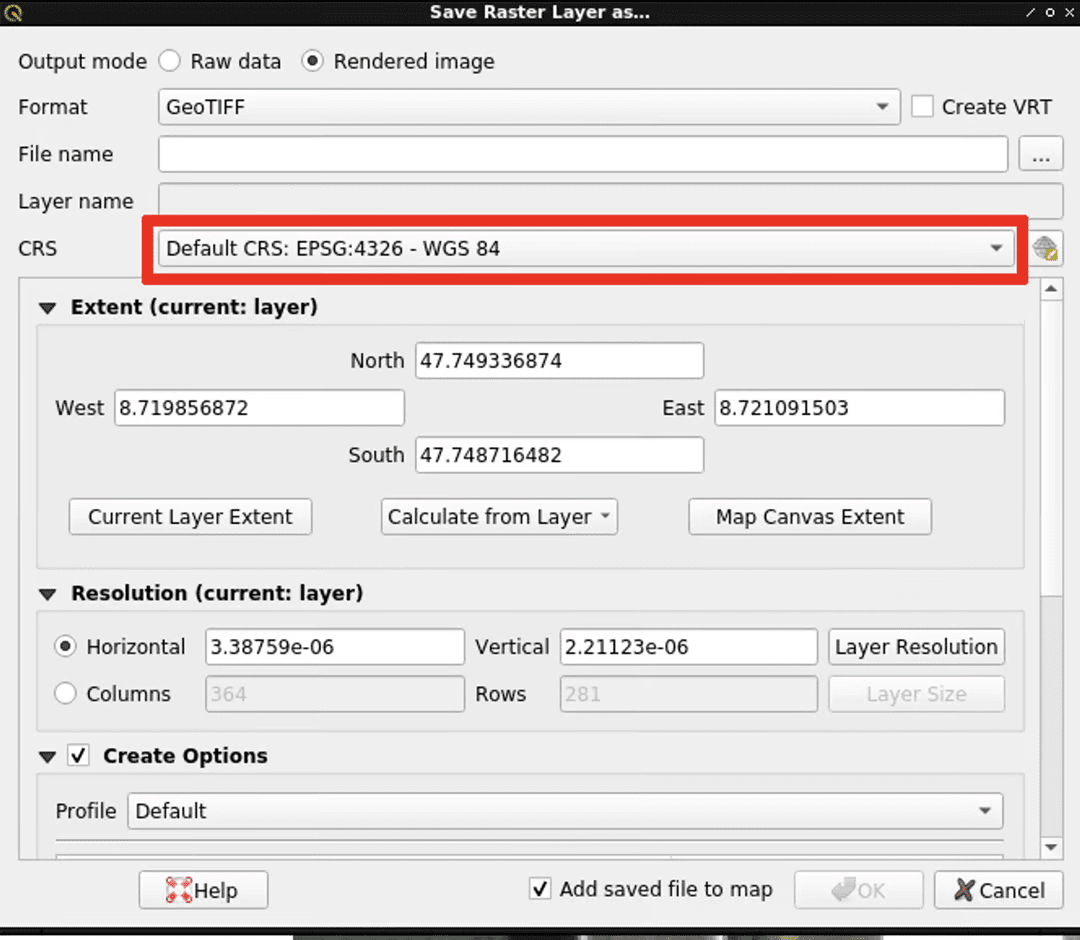
If your image is georeferenced but Picterra doesn’t recognize it
If the image is using an uncommon spatial reference system, it is possible Picterra doesn’t recognize it.
In this case, one way to fix the problem is to load the image in QGIS and save it again by changing the CRS to EPSG:4326 / WGS84 and then upload that new image to Picterra.
The MegaPixels (MP) of an image is the total number of pixels constituting the image, per Million pixels. So 1 MP is equivalent to saying there is 1Million pixels in this image.
This is important since more MP means longer detection time (the model needs to see more pixels).
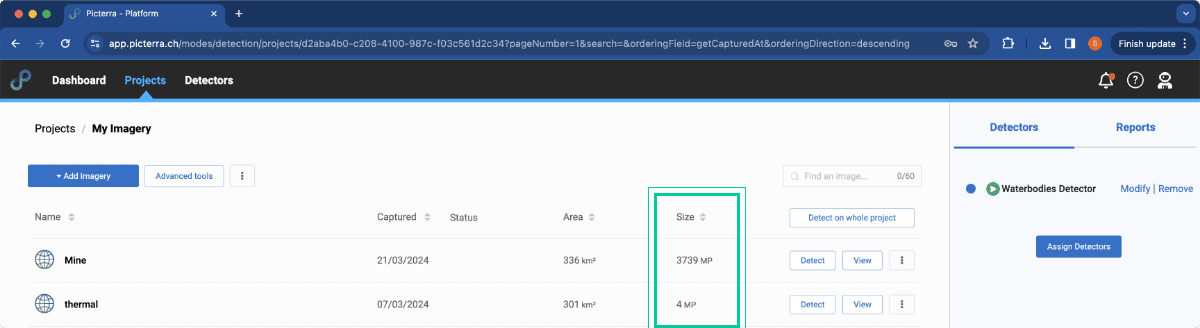
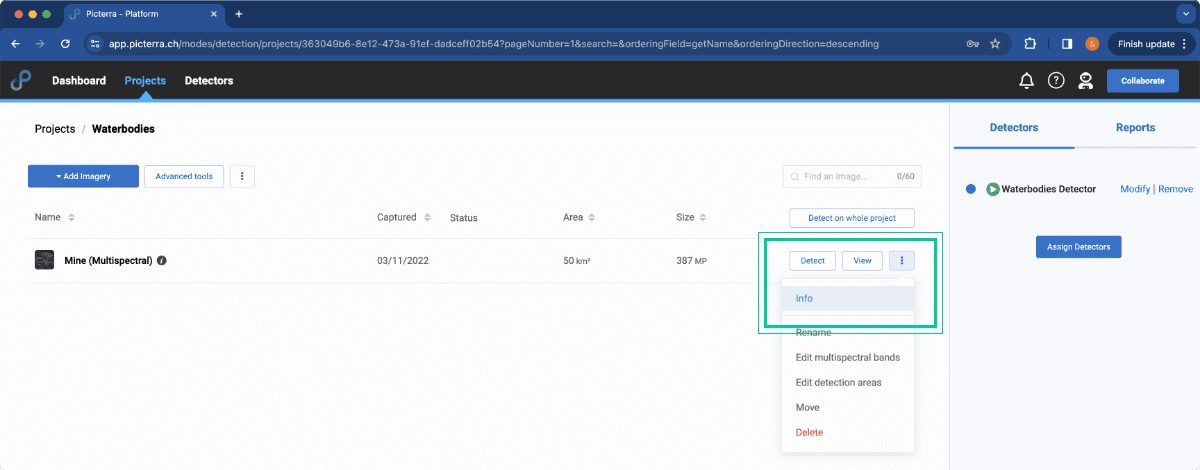
You can at anytime on Picterra platform check the number of MP of an image:
- In a project view, below the column “Size”. This takes into account the “detection area” that has been set to the raster.
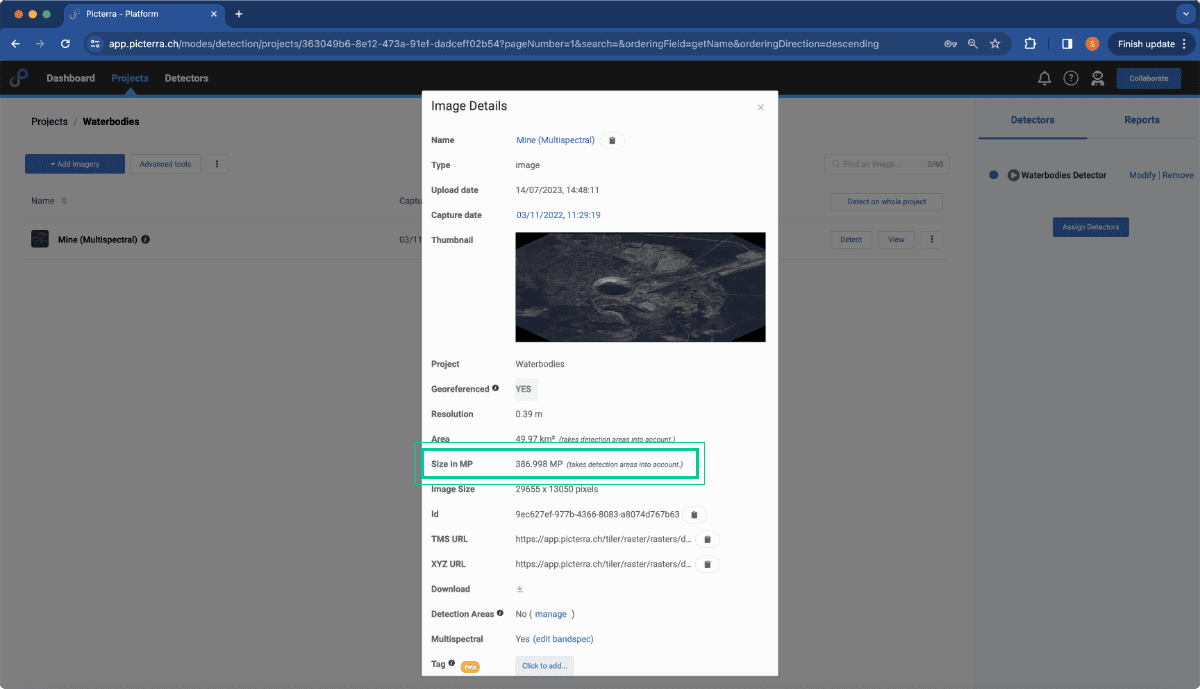
- In the “info” menu of the raster. The Image Details shows the “Size in MP” of the image and its “detection area”.
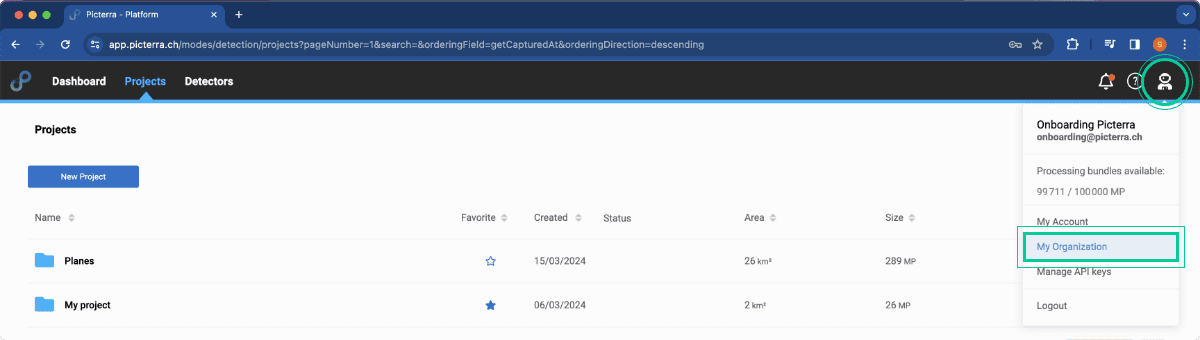
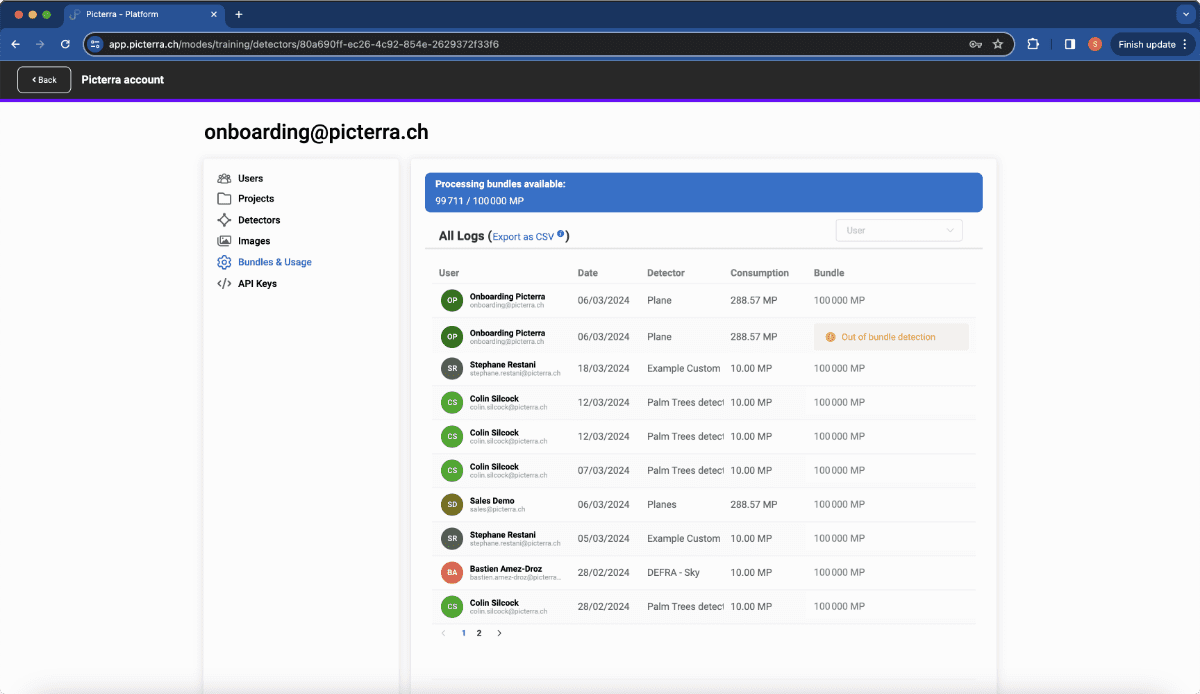
- In the “usage logs”