Geospatial data is in a unique position to positively impact Environmental, Social, and Governance (ESG) goals around the world. It’s an area Picterrians are particularly passionate about given that our mission is to help humanity make better-informed decisions to protect our global ecosystem. With this we want to enable organizations of any size to close the gap between statement and reality when it comes to creating transparent, measurable, and accountable ESG KPIs.
Of course those KPIs can be related to a wide range of variables, beyond the more popular ones such as crops, monitoring deforestation patterns, and tracking water body pollution. In this post we take a look at some of the more unexpected use cases that fall under the sphere of ESG monitoring and hope that it sparks your imagination and curiosity to the possibilities of geospatial intelligence at scale.
Using marmots to monitor biodiversity & boost conservation efforts
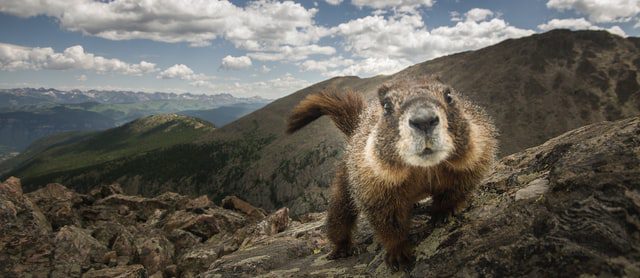
The humble marmot is a large ground squirrel found across Asia, Europe, and North America. Photo by Eli Allan on Unsplash.
Known since antiquity, postulated as a cause of the Black Death, and celebrated yearly during a national Alaskan holiday, it turns out the marmot is also a good indicator within several biodiversity use cases since they play a vital role for the functioning of the ecosystem and the habitat of other species.
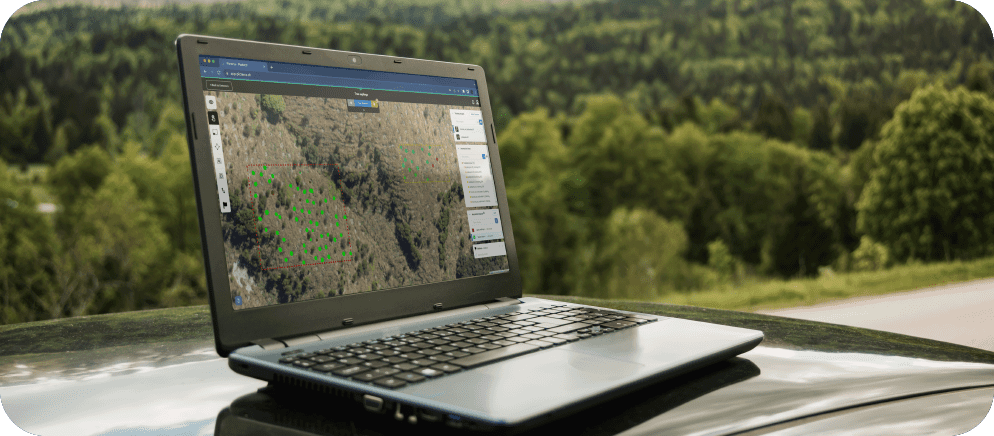
While modern satellite images play a key role for ecology and conservation, they cover a limited timeframe with the earliest high resolution data available from the early 2000s. However between 1959 and 1972 the US Air Force, CIA, and private industry partners launched and maintained the CORONA satellite system which over its 12 years of operation snapped hundreds of thousands of high resolution images. These images were declassified in 1995 and have since been used by researchers to reveal changes in forest cover, surges in tree-felling, and more.
Marmot burrows are visible on satellite images thanks to the mounds of soil that the rodents make as they tunnel into the ground. By analyzing and comparing images from the 1960s and 2000s it is possible to enable a new understanding of how farming is affecting this species and highlight the long-term environmental impact of human activities. This interplay between agriculture and biodiversity enables often overlooked changes to be observed directly.
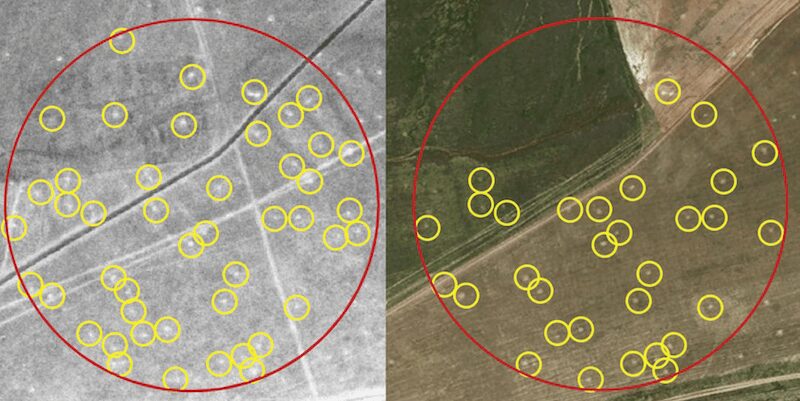
Many of the burrows researchers observed in images taken in the 1960s (left) had been abandoned by the 2000s (right).
Another unexpected use case for tracking marmot burrows is the conservation of endangered species (a topic we have looked at in the past by analyzing pinniped populations using Picterra). In Kyrgyzstan, snow leopards and wolves compete for limited food sources. During the summertime, marmots are an important source of protein for snow leopards and help complement their diet.
Using aerial images from a landscape in the Inner Tien Shan Mountain Range, the Snow Leopard Trust and Ilbirs Foundation are exploring the use of Picterra to estimate the number of marmot burrows so they can assess their relevance for the snow leopards. This effort is part of the Vanishing Treasures programme being implemented by the U.N. Environment Program with support from the Luxembourg government. The project aims to better understand the impact of climate change on snow leopards to improve protection of the ever-diminishing species while supporting local mountain communities who live alongside them.
Identifying irrigated & oxidized holes for tree re-growth
If you’ve taken a flight recently you may have noticed the ability to offset the carbon produced by your travel by adding a small additional charge to the price of your ticket. In fact many companies across industry now offer this facility with the market for voluntary offsets hitting a record $1 billion last year. So called carbon credits are equal to one tonne of carbon dioxide and are usually in the form of a certificate showing that a government or company has paid to have a certain amount of carbon dioxide removed from the environment. But have you ever wondered how such credits are generated and reported on?
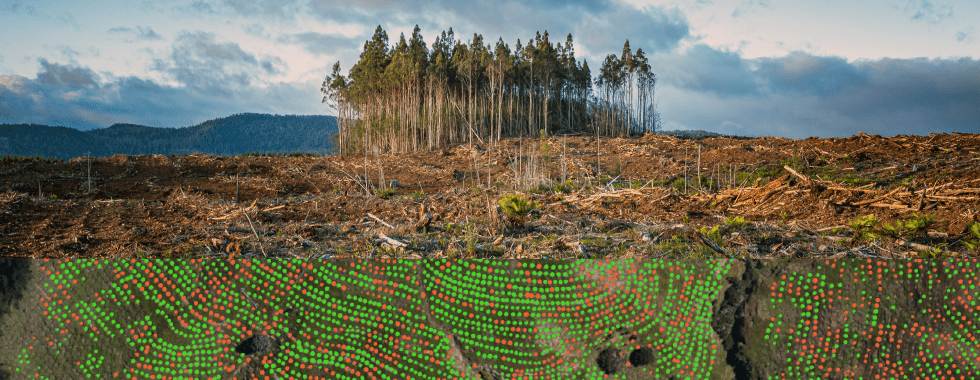
New Zealand Carbon Farming is the largest provider of carbon credits in Australasia and has been in operation since 2010. Their goal is to actively contribute to climate change mitigation by planting 20,000 hectares of new forest by 2030. When expanding their business and adding forests to their portfolio they found that manual, in-person tree counting was too expensive and difficult for saplings. Additionally they needed to scale vegetation management operations without adding environmental or financial cost.
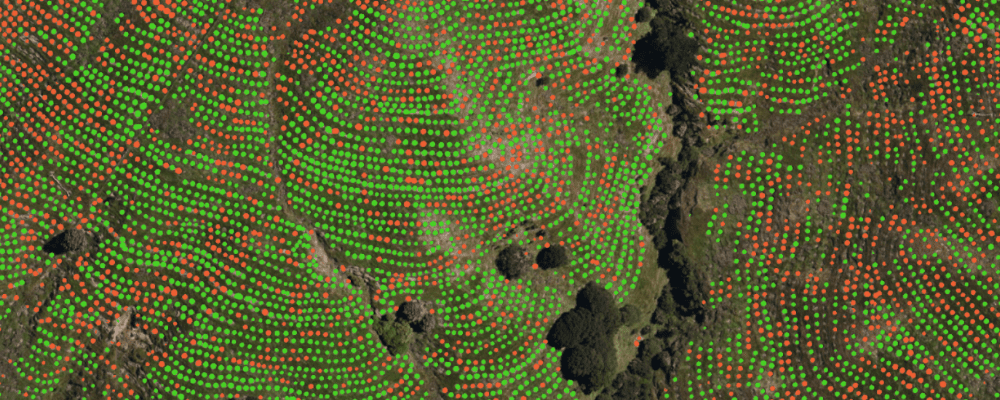
By running ML models across over 10,000 hectares of aerial imagery they were able to identify saplings that have regenerated as well as empty holes that were irrigated and oxidized meaning they were ripe for re-growth. One detector alone was able to identify over 80,000 saplings and 115,000 empty holes. Using Picterra meant they could provide digital records to report on regeneration to their end clients (i.e., carbon credit purchasers) as well as the ability to scale forest management practices when taking on new land to accelerate its contributions to decarbonization.
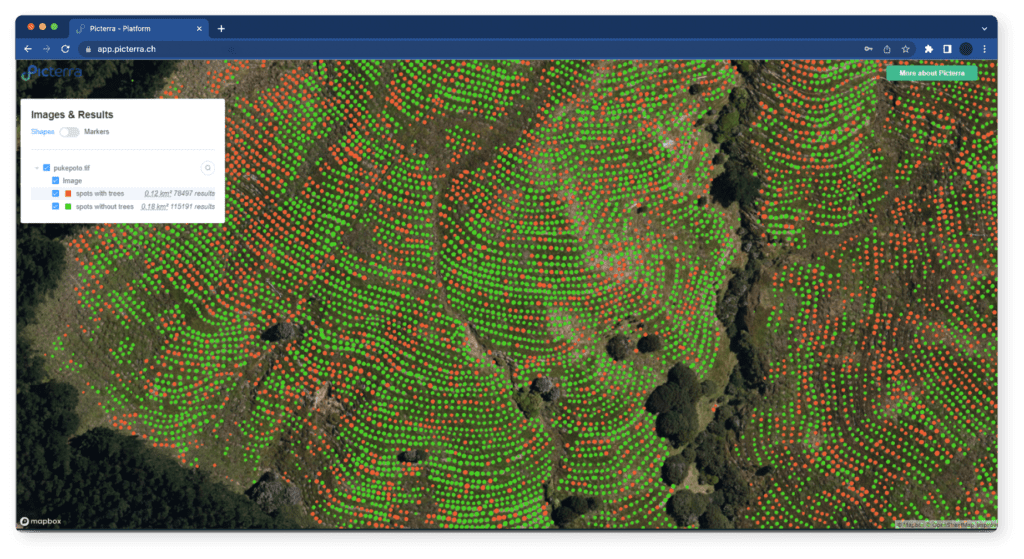
Report on 5cm aerial imagery.
Tackling air pollution and harmful emissions by detecting slurry tanks
While emissions of most air pollutants remain on a downward trend across the European Union, emissions of ammonia from the agricultural sector continue to rise, posing a challenge for EU Member States in meeting EU air pollution limits. A major source of ammonia is from slurry tanks located in farms across the EU and in particular those that remain uncovered.
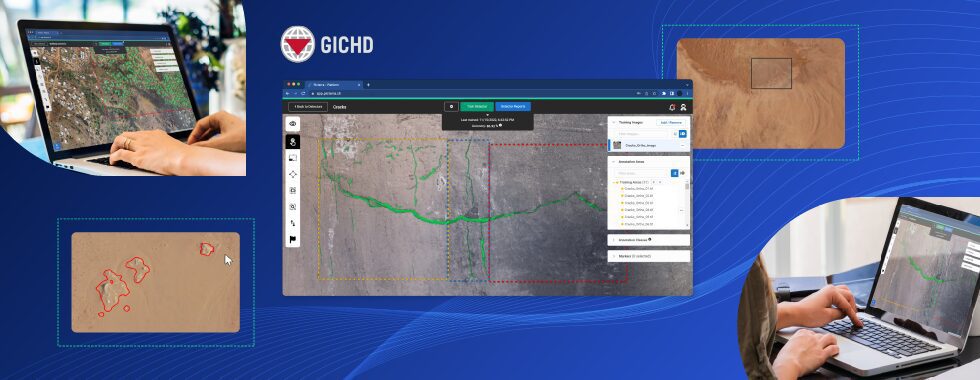
When the Danish Ministry of Environment urgently needed to calculate the total emission of ammonia within the country they quickly realized it was impossible to manually locate and classify all slurry tanks in a reasonable time. Therefore they turned to SEGES, a part of the agricultural advisory service owned by the Danish farmers, to help them find a solution.
Leveraging a combination of machine learning with existing agricultural GIS-databases they were able to detect 26,000 slurry tanks over Denmark in a few hours with only 56 training annotations. Combining this with internal data about the type of production for each farm they produced area statistics for various categories and produced an estimate of slurry tank ammonia emissions.
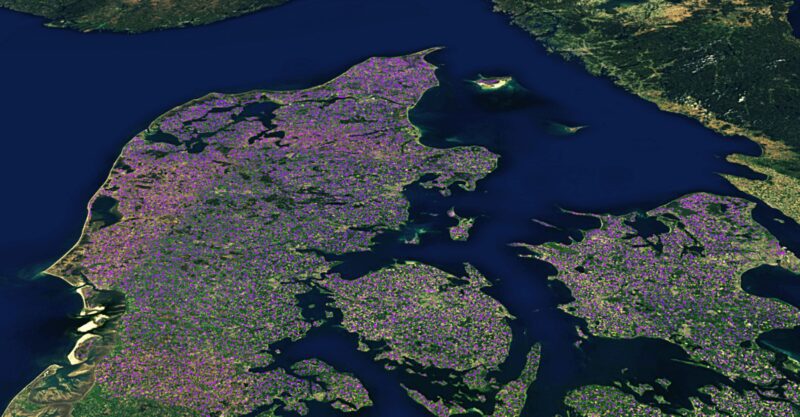
Country scale detection – 34,000 farms in Denmark.
For more details about this use case check out this blog post and interactive map.
Improving sustainability progress and the taste of coffee
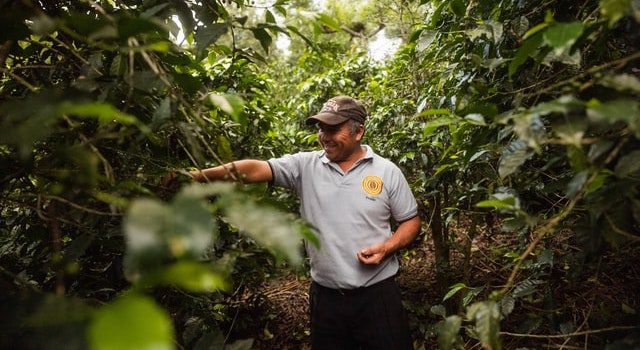
Shade-grown coffee is coffee grown sustainably under a canopy of trees. Photo by Esteban Benites on Unsplash.
Shade-grown coffee greatly benefits the local flora and fauna, the environment, the people working with it as well as the taste by letting the cherries ripen slower. In fact traditionally, all coffee was shade-grown and as a result of environmental degradation, the concept of shade grown coffee, a return to traditional coffee farming, was born.
Coffee trees grown under shaded conditions require less fertilization than trees grown in full sun. For this reason, shade-grown coffee is beneficial to producers who can not afford the cost of fertilization required for intense cropping systems under full sun. It’s also produced with more sustainable farming practices and enables biodiversity to thrive.
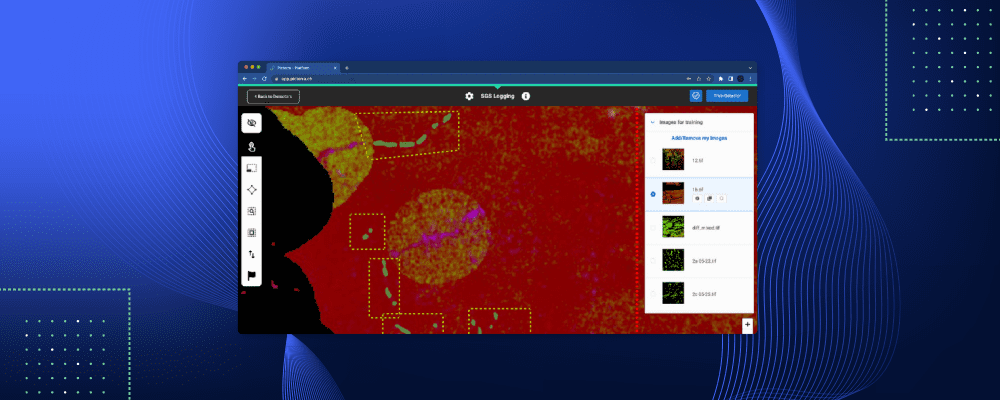
Aerial imagery and machine learning can be used to help monitor sustainable farming practices among smallholder farmers across the supply chain. This not only helps coffee growers to measure the progress on improving the sustainability of coffee cultivation but also speeds up the transition to us all getting better-tasting coffee in the morning!
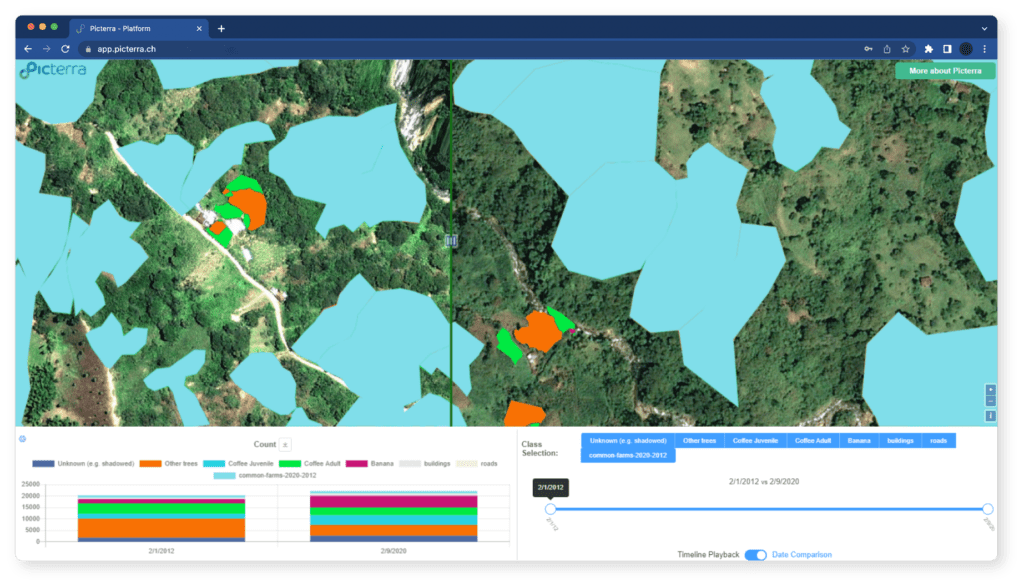
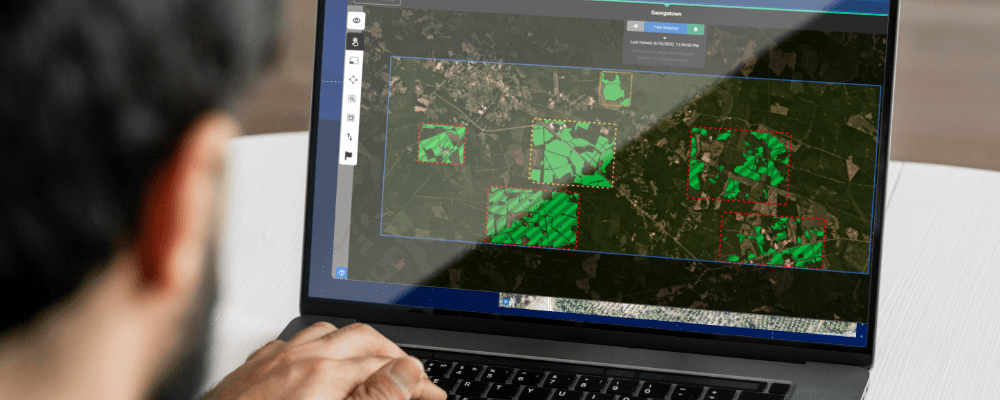
A Picterra FMCG client monitoring farming practices across its supply chain to promote sustainable agriculture.
There are many other surprising and innovative ESG use cases for aerial imagery such as the detection of chimpanzee nests using drones and helping cattle herders find green pastures – imagination is the only limitation!
If you are working on a novel use case or have found one you think we would be interested in, do share it with us on social media using the links at the bottom of the page.
Need a software platform to build your own geospatial based product, application, or business services? Get in touch using the link below!