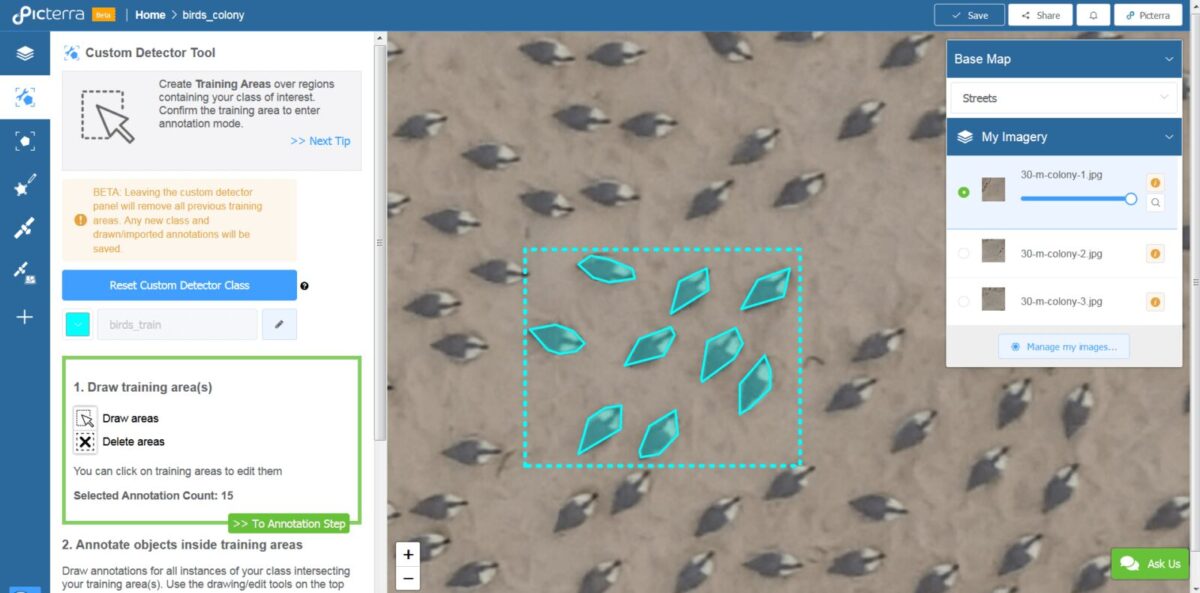
Let’ start with the image “30-m-colony-1” taken at 30m altitude producing a resolution of a few cm. The dataset can be downloaded at https://datadryad.org/resource/doi:10.5061/dryad.rd736. After uploading the image on the platform, we can directly start to build the detector by going to the custom detector tab. There we start by creating a rectangular “training area” containing 8 birds with different orientations. We annotate entirely this training area by outlining these 9 birds using the drawing tool polygon ![]() .
.
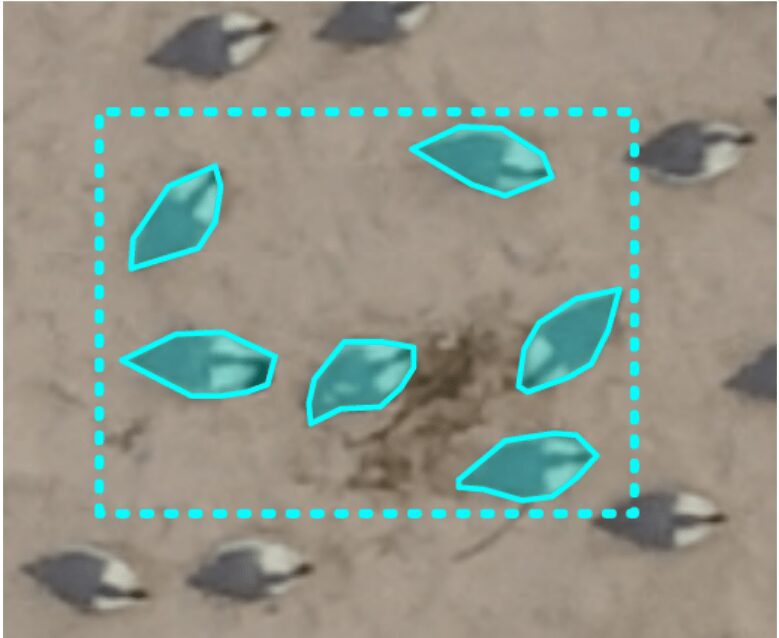
Then we draw a second “training area” around another set of birds with different orientations and close to some darker background elements. This zone is interesting since having again different orientations of birds and variations in the background. Let’s not forget to outline the 6 birds in order for the detector to learn to detect them.
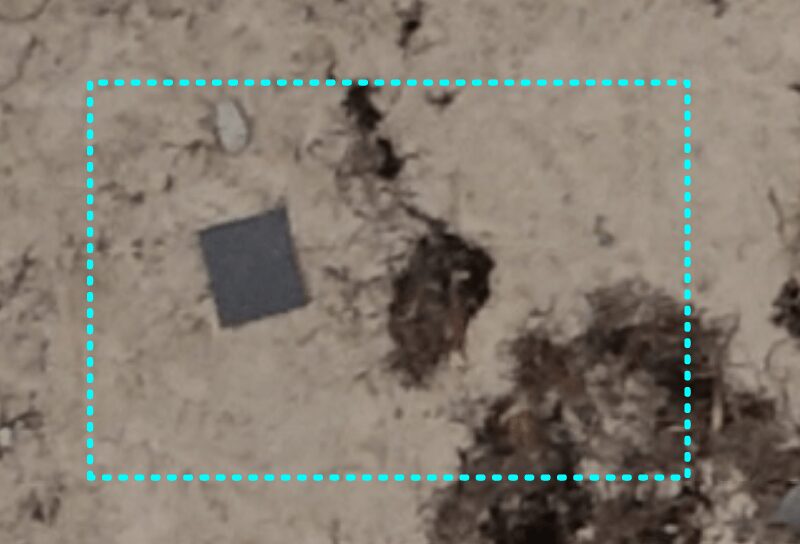
Finally, we draw a third “training area” containing no bird. This area without any annotation in it serves as a counter-example to allow the detector to better discriminate the birds from the background. It will learn that not all gray objects are birds and that dark elements on sand are not a bird either.
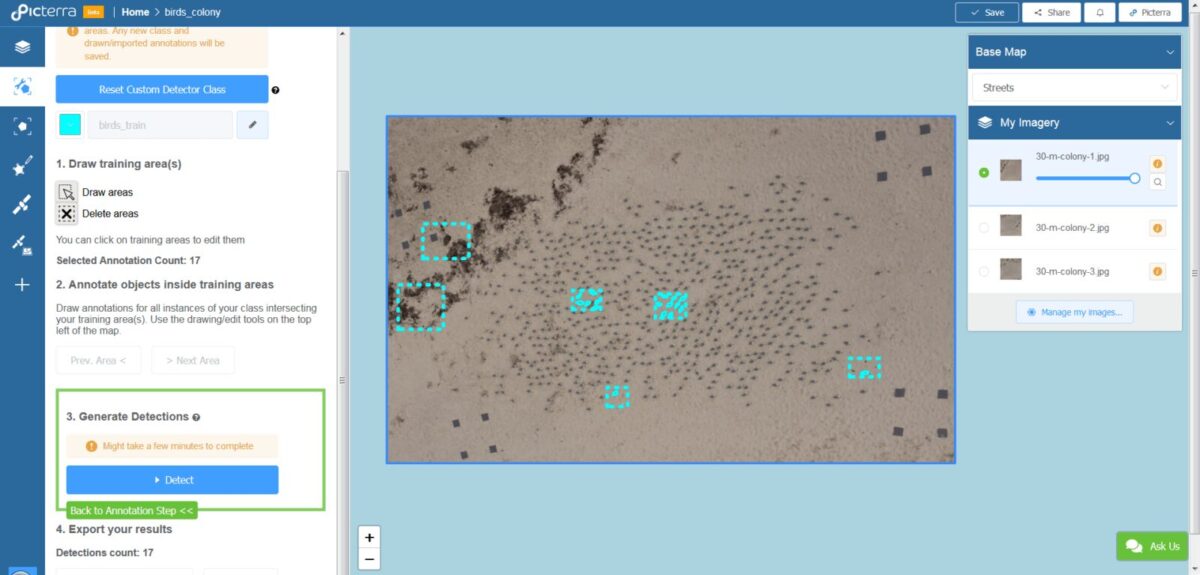
From those 3 “training areas” fully annotated (notice that no birds were left un-annotated in these areas), we launched the training of the custom detector by pressing the “Detect” button. This process takes usually about 5min for training and detecting over this image.
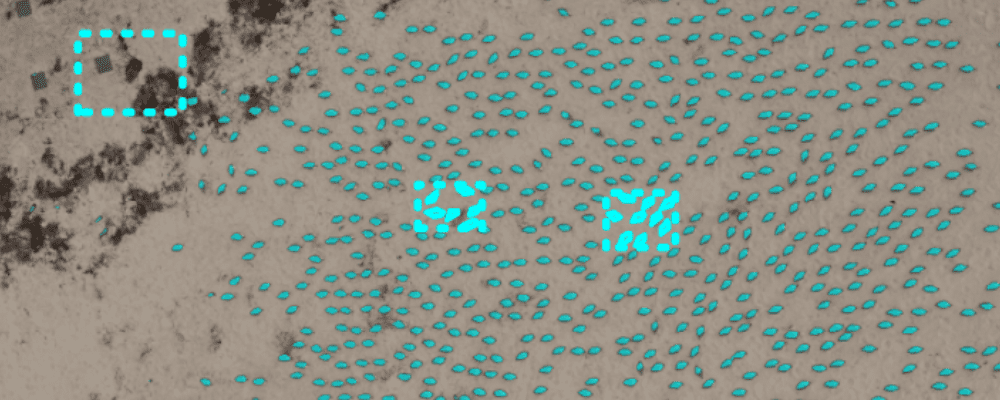
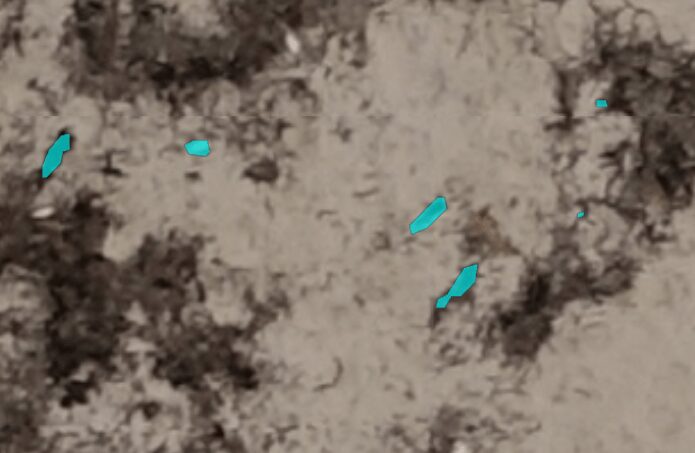
The detections obtained are already promising with all the birds caught. The other main objects (gray square patches, seaweeds, wood pieces) are not detected.
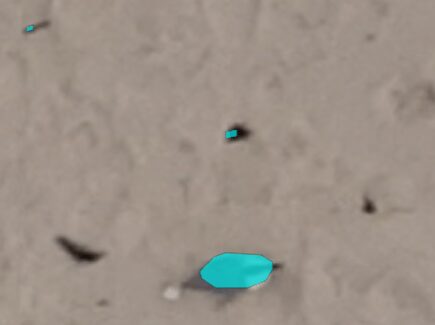
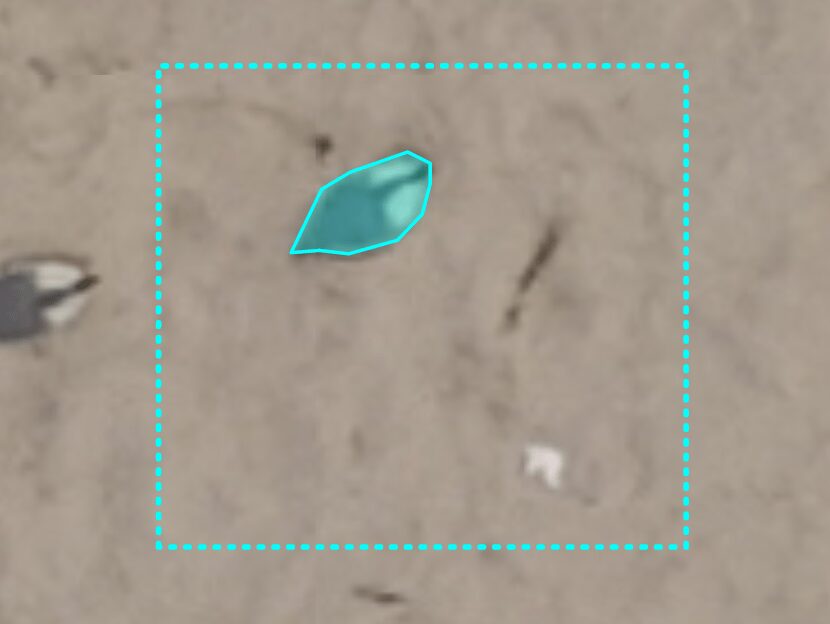
When looking more closely, we noticed that small dark objects were picked up and detected as birds leading to an erroneous count of the bird population on the beach. Here are some close-ups of these elements:
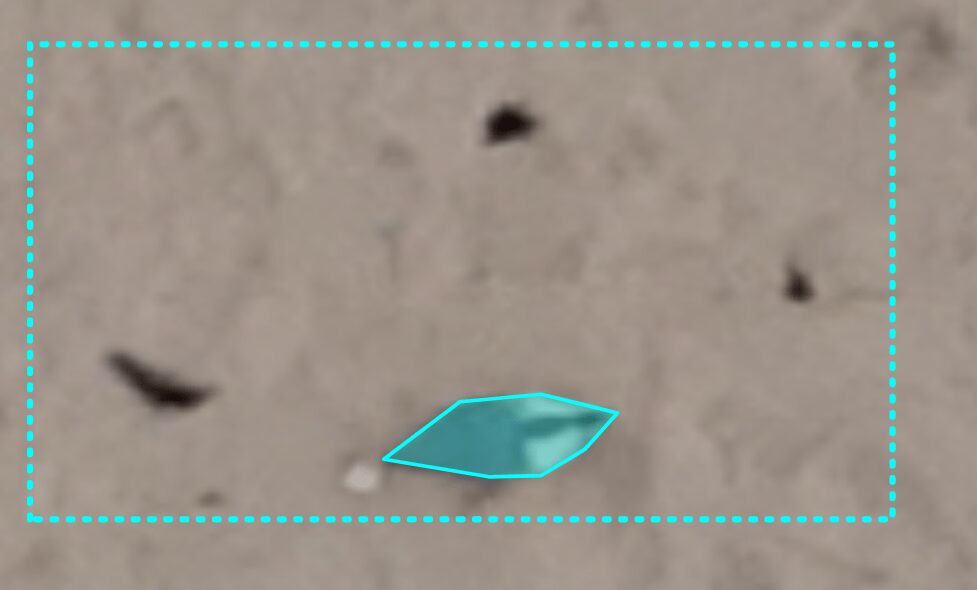
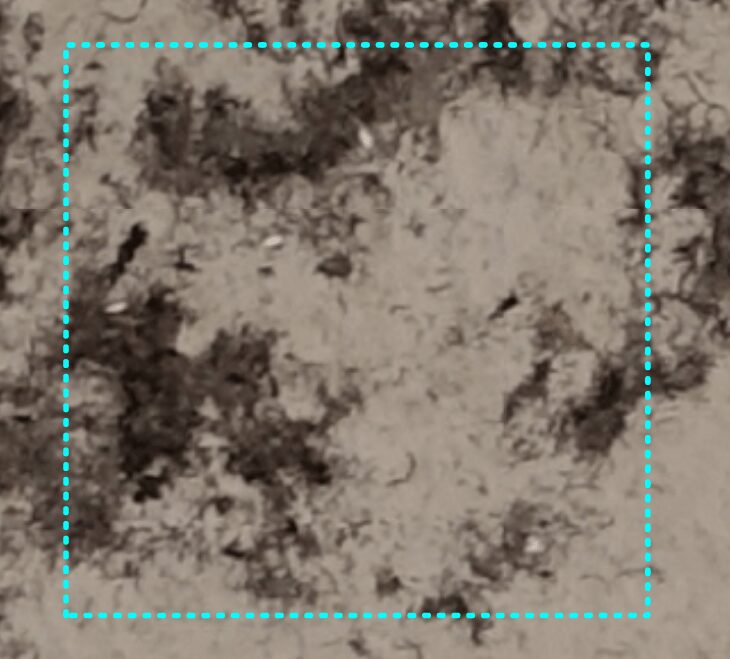
Let’s retrain the model and detect with these 3 additional training areas (setting the total number of training areas to 6).
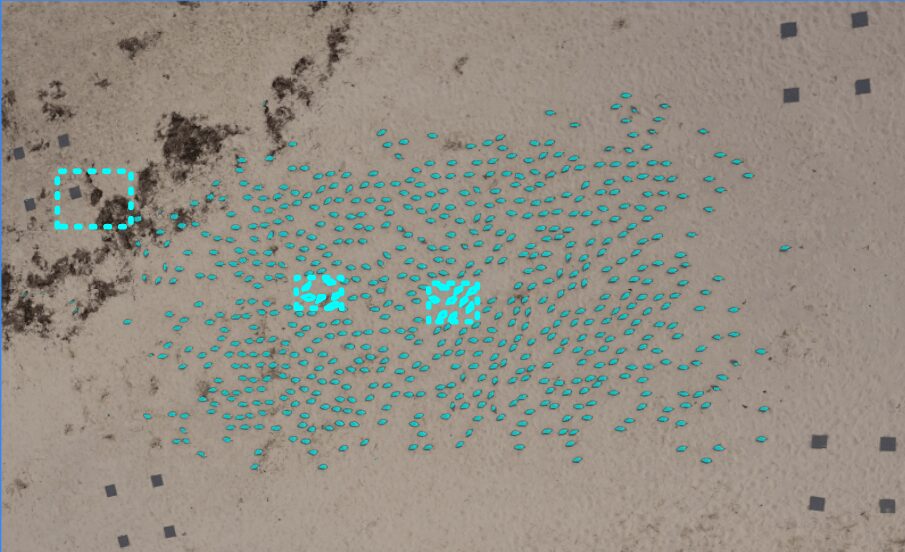
The detections obtained after adding these additional training areas are very promising:
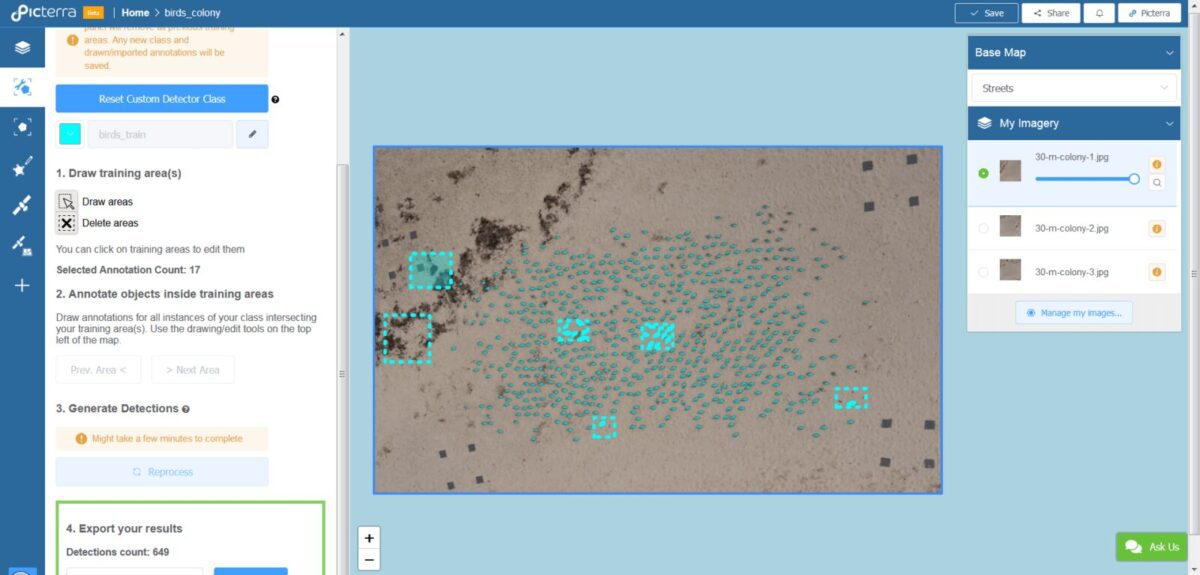
We obtained the detections of all the birds with a count of 649 with these additional training areas (setting the total number of training areas to 6 and the number of annotations to 17 birds). The groundtruth count is 636, representing an error of detection of 2% on the total population. Knowing that these where done in 15min with only 2 iterations, the trade-off between accuracy and complexity of training the detector can be well controlled. Someone requiring higher precision would do another iteration with for example an additional training area in the top-right corner where some birds are less well detected.
See you for our next post of the “Custom detector” series and have fun with the custom detector!
The Picterra team