Lausanne, Switzerland, January 18, 2024 – Picterra, a leader in geospatial AI enterprise software, today announced a new set of enhancements to its platform for detector insights, further refining the features introduced in an earlier update. Building on the success of the previous release, which included features like detector performance summaries and improved area of interest (AOI) management, this update introduces per-accuracy area scoring, confidence maps per accuracy area, and accuracy area result warnings. These new features are designed to augment the detailed insights of earlier advancements.
By expanding detector insights with a focus on user-specific dataset areas, particularly in training and accuracy, Picterra continues to demonstrate its commitment to evolving in response to user needs and industry advancements. These enhancements offer users a more granular and precise understanding of their geospatial data, facilitating more accurate and efficient decision-making in various applications, from environmental monitoring to urban planning.
The integration of these new features with the previously introduced tools creates a more cohesive and powerful platform for geospatial analysis. We encourage users to explore how these latest updates can complement their existing workflows and bring additional clarity and control to their projects.
Per accuracy area scoring
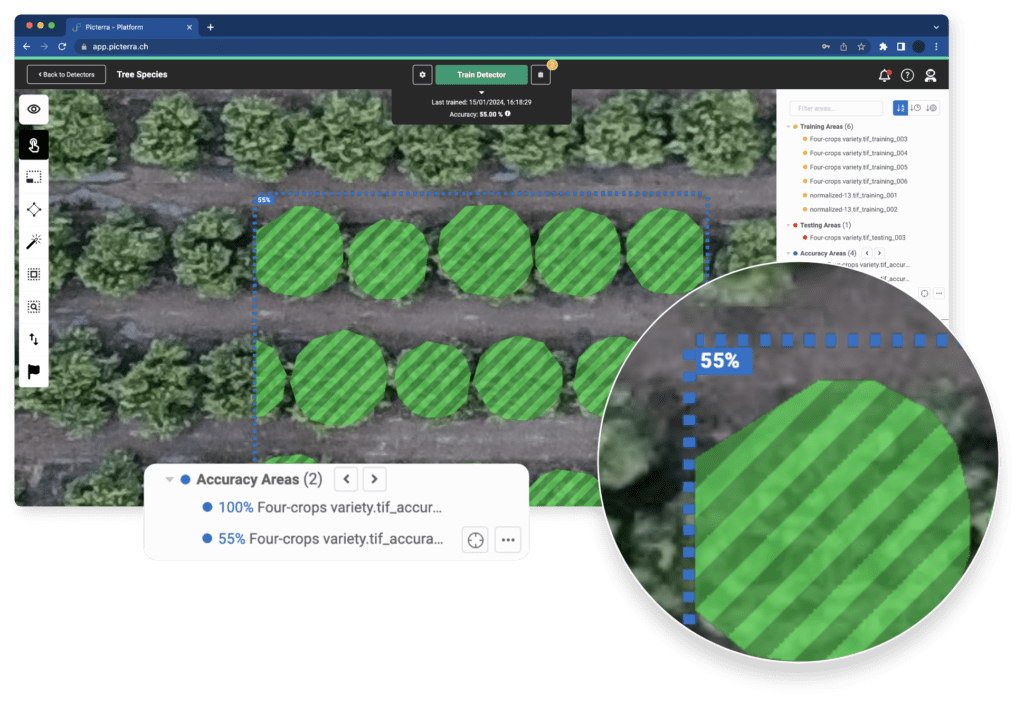
Per-accuracy area scoring is a feature that enhances the way users can assess the performance of their geospatial data detectors. Accuracy areas within Picterra enable you to determine the relative performance of the model that you are building. This new functionality allows for a more detailed analysis by providing accuracy scores for each area within the detector, rather than just an overall accuracy score.
Key features:
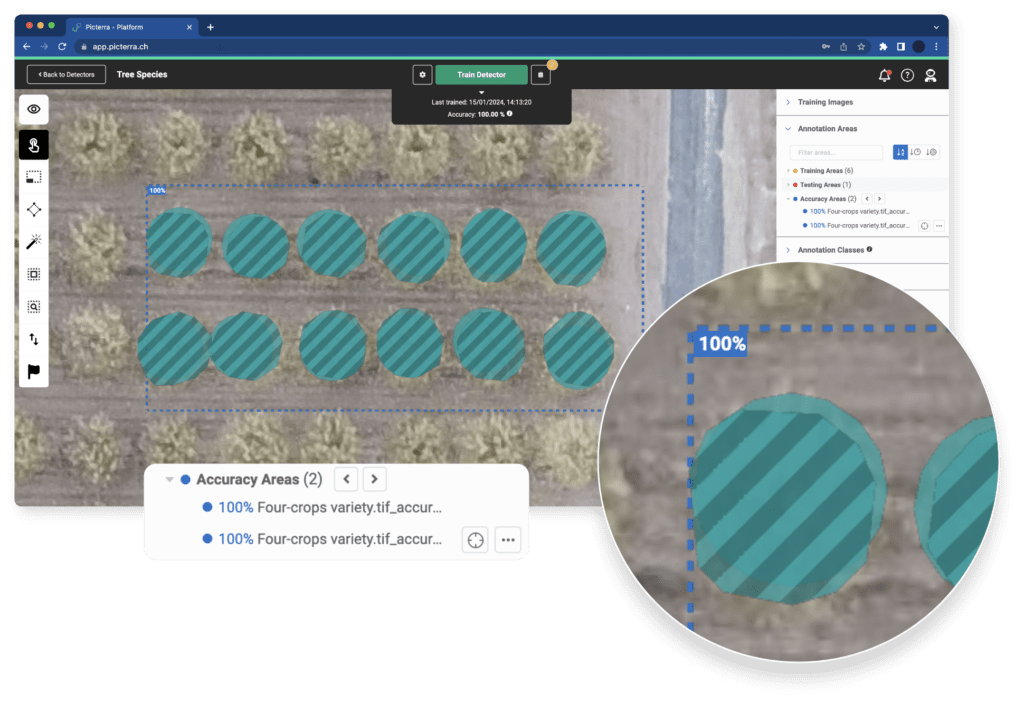
- Individual area accuracy scores: Users can now view the accuracy score for each specific area, displayed prominently on the area in the image view. This level of detail is crucial for identifying which parts of the dataset are performing well and which might need further attention or improvement.
- Convenient score display and sorting: Accuracy scores are also listed in the right-hand panel of the results management interface, providing an easy overview of all areas. This list can be sorted by scores, enabling users to quickly identify areas with lower performance and prioritize them for review.
- Direct navigation to areas: Clicking on an accuracy area in the list will bring users directly to that area in the image view. This feature streamlines the process of analyzing specific areas, making it more efficient to focus on and address any issues identified by the scoring.
This feature is designed to help users better understand the strengths and weaknesses of their datasets and detectors. By providing a more granular view of accuracy, it empowers users to make more informed decisions about how to improve their geospatial analysis projects.
Confidence maps per accuracy area
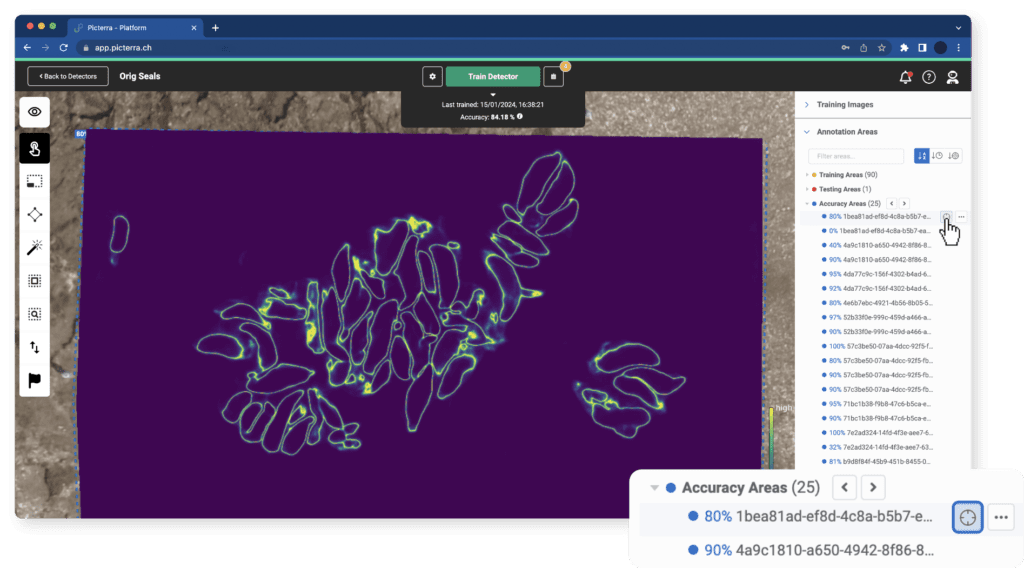
Expanding on a concept we previously presented, our latest update brings to fruition the implementation of confidence maps, now available for both accuracy and testing areas. This feature provides users with an overlay on images that highlights areas where the model is uncertain about its detections, effectively visualizing where the model may be underperforming.
Visualizing model uncertainty
- Heat map overlay: The confidence maps feature displays as a heat map overlay on the images. Brighter colors on the map indicate higher levels of uncertainty in the model’s detections. This visual representation helps users quickly identify areas where the model’s confidence is low.
- Application to accuracy and testing areas: Users can activate confidence maps in both accuracy and testing areas. This is done simply by clicking a button in the area panel, enabling an immediate view of the model’s confidence levels in these specific zones.
Enhancing model analysis and improvement
- Identifying areas for improvement: The primary utility of confidence maps lies in their ability to guide users towards parts of their dataset or detector model that may need refinement. Users can first examine the accuracy scores in specific areas and, if the scores are low, use the confidence maps to further investigate and understand the underlying issues.
- Interpreting confidence maps: It’s important to note that some uncertainty is expected, particularly around the edges of objects, as these are naturally more ambiguous regions for detection models. Users can focus on significant bright spots within the maps, which indicate areas of higher uncertainty and potential for model improvement.
By integrating confidence maps into the accuracy and testing areas, Picterra provides a powerful tool for users to not only identify underperforming areas but also to gain insights into how to improve their models.
Accuracy area result warnings
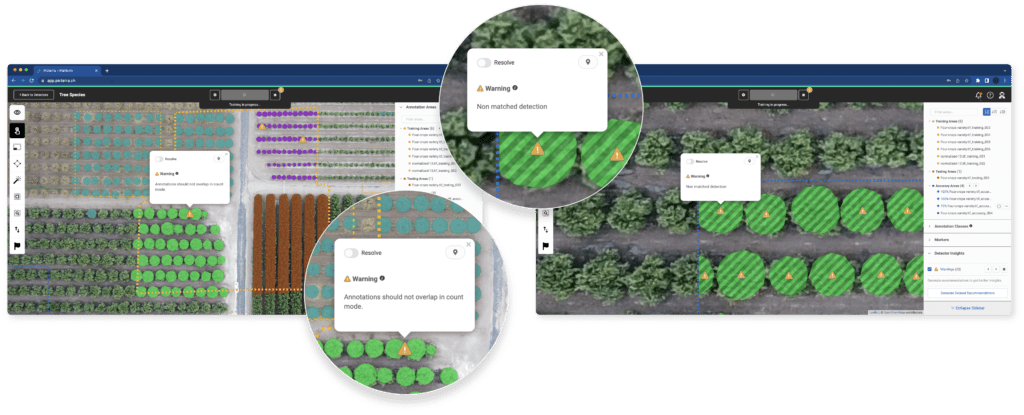
Finally, this update extends and enhances the previously released localized warnings. This new functionality is designed to provide users with specific guidance on areas within their detector where the annotated ground truth and the model’s predictions do not align. It serves as a critical tool for identifying discrepancies and improving the overall accuracy of geospatial models.
Identifying discrepancies between predictions and ground truth
- Types of discrepancies: The warnings highlight various types of mismatches, such as instances where a prediction exists without matching ground truth, cases with ground truth but no matching prediction, scenarios with partial overlap not enough to be counted as a match, and situations where the classes detected differ from the annotated ones.
- Focused on count mode: Currently, these warnings are available in count mode, with plans to extend the functionality to segmentation mode in the future.
Guiding the review and correction process
- Streamlined review: The accuracy area warnings are particularly useful for users managing large numbers of accuracy areas. While manual review of underperforming areas is always possible, these warnings aim to guide the review process more efficiently, pointing out specific spots for closer examination.
- Process for addressing warnings: To address these warnings, users should review and potentially revise their annotations in both training and accuracy areas. Experimentation with detector settings and classes may also be necessary. It’s important to note that after each training session, only a subset of warnings is shown, specifically over the worst-performing accuracy areas, to avoid overwhelming users with excessive notifications.
- Aiding detector experimentation: The primary goal of these warnings is to guide users towards areas that need improvement, facilitating a more targeted approach to enhancing detector performance. This feature is not intended to point out every error but to provide insights into broader trends and areas of concern in the results.
This feature represents an important additional step in making geospatial data analysis more precise and user-friendly. By pinpointing specific areas for improvement, Picterra helps users refine their models and achieve higher accuracy in their projects.
Key benefits
These updates focus on increasing the precision of detector insights and streamlining the user experience, ensuring more efficient and accurate geospatial data interpretation.
Improved accuracy and detailed analysis
- Granular performance understanding: The ability to view individual accuracy scores for different areas allows users to identify specific parts of their dataset that may require additional refinement, leading to more accurate overall model performance.
- Confidence level visualization: Confidence maps provide a visual representation of areas where the model has lower certainty in its predictions. This visualization helps users quickly focus on key areas of interest, enhancing the quality of their analysis.
Streamlined process and user experience
- Efficient area analysis: With functionalities like sorting accuracy scores and direct navigation to areas of interest, users can quickly identify and address underperforming regions, saving time in the analysis process.
- Targeted error detection: Accuracy area result warnings pinpoint specific mismatches between predictions and ground truth, allowing users to focus their efforts on correcting these discrepancies.
Versatility across various applications
- Broad use cases: These features are applicable in a wide range of scenarios, including environmental monitoring, urban planning, agriculture, and more, making them valuable for diverse industries and applications.
Enhanced model tuning: The combination of detailed accuracy scoring and visual confidence maps assists users in fine-tuning their models for specific applications, leading to better-tailored and more effective geospatial analysis.
Get started
These updates reflect Picterra’s commitment to innovation and continuous improvement, ensuring that our users have access to the most advanced tools in geospatial technology. The integration of these new features into our platform empowers users to delve deeper into their data, uncovering valuable insights with greater clarity and confidence.
We encourage you to experience the benefits of these new features firsthand. Check out our plans, sign up for a free trial, and start experimenting with per-accuracy area scoring, confidence maps, and accuracy area result warnings. We value your input and experiences. Share your feedback on how these features are impacting your projects and any suggestions for further enhancements.