One of Picterra’s main focuses is to provide not only easily accessible but also easily understandable machine learning tools to our users. To that end we’re adding another set of machine learning settings to the custom detector builder to give you more freedom with your ML experiments on Picterra and hopefully boost performance of your models. For starters we are adding the following three:
- backbone model
- training tile size
- background sampling ratio

While we have labeled these as “advanced” machine learning settings in the platform, we have chosen them still because they are both understandable in that there are ways to gain intuition about how to use them well and because we have seen in our internal experimentation that they have the potential to actually improve your detectors. Both the intuitiveness and the potential performance gains are important factors in determining potential detector setting candidates on the platform. In this article we will go through each of these three, explain what they do, and provide an example of where it may help.
Backbone
This first setting involves the feature extractor portion of the network. Deep learning models have a start and an end. The start is where you provide the input to the model (the images) and the end is where you get the output (the detections). At the start of the network there is a sub-network dedicated to extracting features from your imagery. Let’s not confuse this with the word “feature” used in GIS lingo, which refers typically to actual objects or elements in your image. A feature here is basically a list of numbers per pixel that encodes some kind of information about the image, they are defining characteristics of your images and objects of interest, but turned into something less qualitative and more quantitative. It’s using these features that the rest of the deep learning model decides whether or not a pixel belongs to your object of interest or not and from that can produce detections.
The backbone model is exactly this first feature extractor sub network and it can be helpful sometimes to swap it out with different sub networks. Our default backbone is Resnet34. There are variations of this backbone model that we can use as well, like Resnet18 and Resnet50, the latter being a lighter faster to train model meant for smaller datasets, whereas the former being heavier, slightly longer to train, but also better for more complex scenarios and larger datasets. It really shines during multiclass applications where your detector needs a bit more bandwidth to help separate similar looking objects into many different classes.
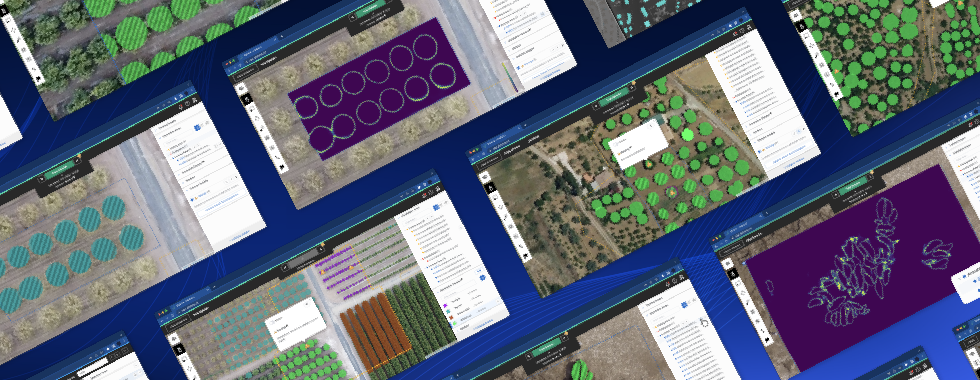
Here is an applicable case where we have a 10 class dataset on planes, where indeed some of the classes can look quite similar. We trained the detector on both Resnet34 (the default) and Resnet50. Let’s compare some of the mistakes that the Resnet34 version made to the corrected results using the Resnet50 backbone.

Resnet34 on the left, these should all be the same class of plane. On the right we see results from switching to Resnet50, where the model was able to better learn the difference between similar plane types and correctly classify all the planes in this area.

These planes should all be classified into the “cyan” class. On the left with Resnet34 you see that it mistakenly classified most of them into the “yellow” class which was a plane that was similar in size but a different wing angle. On the right, you see that with the Resnet50 model most of them managed to be corrected.
In the future we may consider adding more different varieties of backbone models, such as Efficient Nets but these will require further testing to see whether or not they are actually worth adding in terms of potential performance gains. What we’re trying to avoid here is having a long laundry list of backbones just for the sake of having them.
Tile size
Whenever you train a detector you are feeding your training areas to a deep learning model one after the other. These models need a fixed image size to be passed into them, which is just the nature of how these models work in training. Let’s call this fixed size image a “tile”. For us the default tile is a 256 x 256 sample of one of your training areas, which is quite standard in the machine learning computer vision field. If your training areas are larger than this, a single tile will only encompass a subpart of that area. This is fine because we will select a tile from each of your training areas multiple times during training and each time we randomly sample the location of the tile in your training area, the idea being that eventually after multiple training steps all training area contents will be seen.

Training tiles as seen in the training report
However, sometimes this tile size is simply too small. Say your object is too large to fit into a 256 x 256 tile and the full object is never seen in one tile by your model. This is like trying to learn what a human face looks like but you’ve only ever seen separately a nose, or an eye, or a mouth, but never all of it together. It can be achieved, but it makes the task harder. The way we’d get around this problem with Picterra previously was to use the detector resolution setting to scale down your images, which can work fine in many cases but in doing so you also lose detail in your image. If that detail is important in producing correct detections (which depends on your use case), then it may not be such a good idea to scale down that imagery. However, if we just increase the tile size then perhaps we can fit the entire object in a single tile without losing detail, and that’s what the tile size setting does. Instead of scaling your imagery down by two, you can increase the tile size from 256 x 256 to 512 x 512 for example.
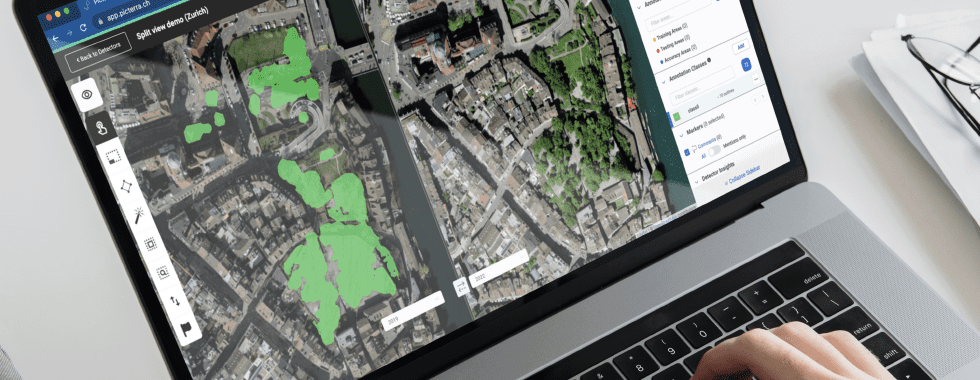
Here is an example dataset of where this setting has helped in improving the results, producing a full 5% increase in performance (from 63% to 68%) on a difficult and complex problem.

Missing some paving on the left as well as a falsely detected rooftop. Improved results on the right (no rooftop detection at all).

Falsely detected road on the left, correct on the right.
Despite not looking for a specific object (this is a segmentation detector), the tile size is still helpful here because the “paving” in here is defined as basically being not the main road for vehicles, which means the class contains multiple different appearances and textures. Of course there are still rules in what materials are used for which and so scaling the imagery down can be detrimental because you lose detail of the texture of the materials.
However, a major factor in how we as humans would determine whether or not something is pavement is not just by its material but also its surrounding context.
We can tell something is a sidewalk because it’s a narrow linear element next to a larger wider linear element, the road. Since the context is important, having more of it is helpful. So how can we increase the context while still maintaining the texture detail? By increasing the tile size. This dataset in particular could also use more data, and perhaps multiple classes, to improve the score further, but that’s a different story.
It sounds great on paper but of course there are a few drawbacks. It may not always perform better as expected. Also it may not even be the details that are important for the model to learn what your object is anyways (in the end it’s not us who decides what details in the images to use during training, it’s the model’s responsibility to do that automatically). As mentioned earlier, it really depends on your use case. In addition increasing the tile size means increasing the GPU memory of your model. A bump from 256 x 256 to 512 x 512 means 4x the GPU memory. This means your training will also take 4x longer. In short this setting can be quite helpful but it’s important to experiment and play around with it to see if it can be of benefit to your detector.
Background sampling ratio
The final setting is the background sampling ratio which defines how many tiles per batch (always set to 32) are dedicated to sampling over background. What does this mean exactly? Earlier it was detailed that we randomly sample tiles from within your training areas. Some tiles or regions of tiles will contain fewer annotations and more background than others, or perhaps no annotations at all. It’s important to strike a balance between how many foreground and background samples you have to make sure your detector sees a proper amount of each. This “proper” amount however is something that can vary from use case to use case. It is highly dependent on the complexity of your imagery and what your detector is having difficulty with. For example, if you are having trouble getting a lot of false positives (bad precision) maybe you want your detector to sample more background regions to make it understand better that these regions are really just “background” and shouldn’t be detected. Or perhaps you’re having the opposite problem with false negatives (bad recall), then maybe you want to decrease this value so that you see more “foreground” (or annotated) pixels. As before it’s not an exact science, but something to experiment with if you see a clear trend in how your detector is outputting results or a large difference in the precision and recall scores that’d you’d like to bring closer together.
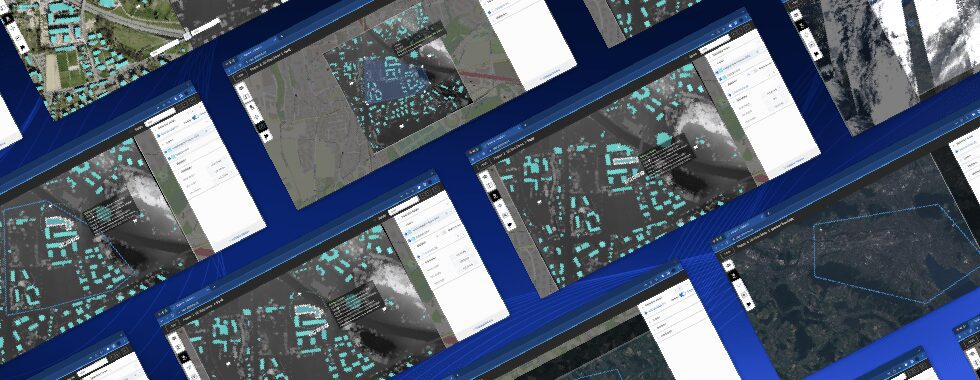
In this next example the client was attempting to detect small bodies of water in a mountainous region (the alps) from low resolution satellite infrared imagery. The bodies of water themselves are not particularly complex objects. They basically just look like dark blue blobs. But we need to make sure that we don’t falsely detect any other “dark-ish” looking blobs as lakes. Comparing the results of the background sampling ratio at 0.1 to 0.5, we can see a clear difference in results.

Using a 0.1 background sampling ratio

Using a 0.5 background sampling ratio
We can see that the IOU score got a pretty big bump, but in addition the precision also had an increase of about 5%, which means we probably have less false positive detections. Comparing the results visually we do indeed see examples of this.

False positive detections on the left using a background sampling ratio of 0.1, not present on the right where we use 0.5.

False positive detections on the left using a background sampling ratio of 0.1, not present on the right where we use 0.5.
Settings we didn’t expose
We did not expose some of the more traditional detector settings such as batch size, learning rate, optimizer, and scheduler. Why? The decision was made based on an assessment of the trade-offs between use-ability and impact. For the parameters listed above, changing them from our defaults either resulted in little to no change in our large experimental dataset suite, which has been gathered across many different use cases and users. Our tests revealed no patterns whatsoever in how they could potentially be used. Additionally they are also not very visualize-able and intuitive parameters for non ML experts. Keeping in mind that our focus here at Picterra is to make machine learning both impactful and more accessible, these settings failed to satisfy either of those requirements.

Remember that we also have the original detector settings for you to experiment with here.
Experiment!
All of these settings can potentially improve the performance of your model. I say “potentially” because we do have some rough guidelines but just as is the case with adding new data or using the recently released multiclass feature, it’s never a 100% guarantee. Over the last few years, we’ve learned here at Picterra that creating a good machine learning model relies on experimentation, both in the dataset creation as well as some of the model’s settings. Therefore, we strive to remove as much tedium from the model iteration and improvement process as possible. In some cases, say one with issues concerning false positives, objects that are too large and multiple classes, perhaps by optimizing these new advanced parameters you can get a massive performance boost!
In the future we will expand on this concept of experimentation by improving our UX and UI to allow our users to keep track of the history of their experiments more easily and how each change affected their detectors’ results, an experiment workbench of sorts. These settings along with the workbench will be available to users who really want to push the boundaries of what their detectors can achieve!