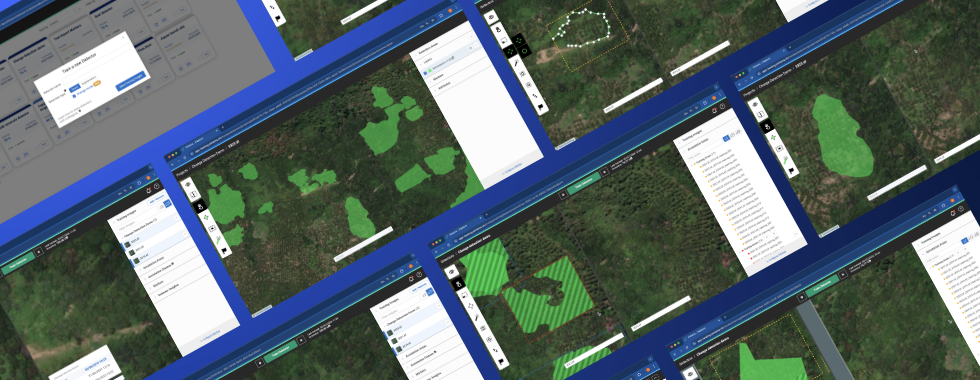
This week, we have released a set of features that further improve how change detection works within the Picterra platform. The new approach allows you to create a dedicated change detection model to identify changes between two images taken at different times. For example, it can detect appearing or disappearing objects or land cover changes. You can focus on specific changes, like a building’s construction phase, and train a machine learning model based on these annotations. This method is more flexible and efficient, using a single model to analyze a pair of images.
With the release of these new features, Picterra now supports a dedicated automated UI/UX for building change detection datasets and a dedicated change detection machine learning architecture.
UI / UX
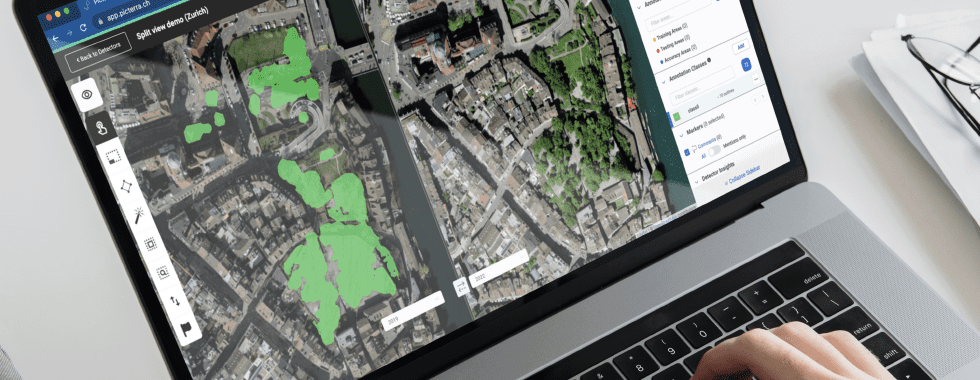
Split view
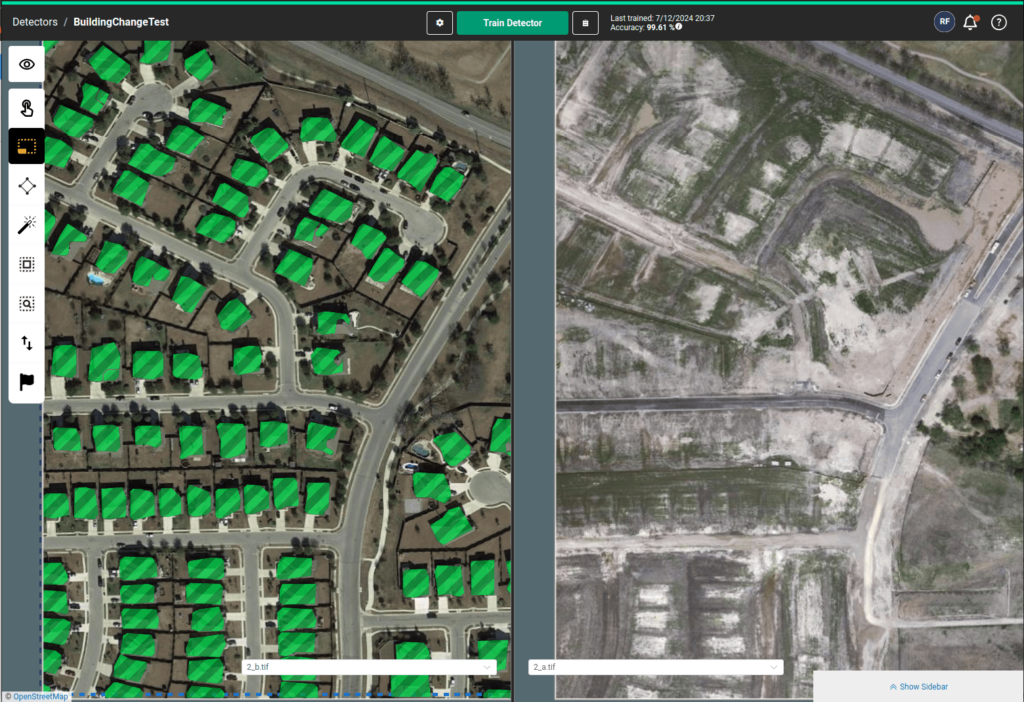
Change detection is a task where you have two images taken at different times and you want to train the machine learning model to detect changes. For example, let’s say you are monitoring a construction site, and one image was captured before construction began and the other after it was completed. In this case, you would want the model to detect “newly constructed buildings,” so you would draw those new buildings on the image taken after construction to create a training dataset.
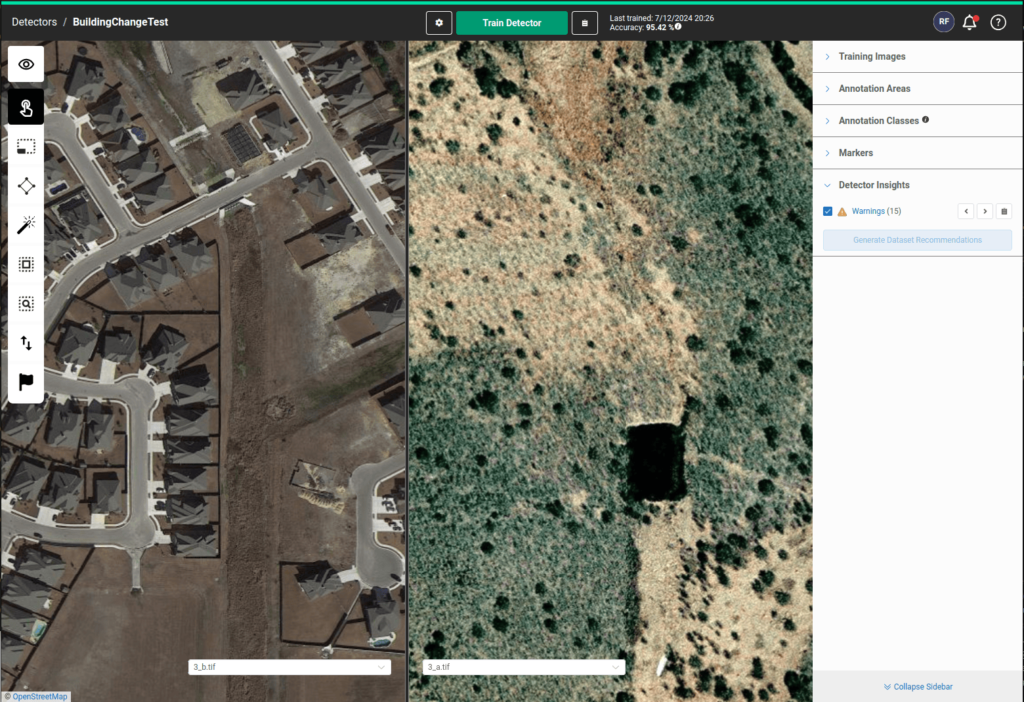
To be able to draw only the changes (new buildings in this case), you need to look at the two images at the same time. After testing multiple approaches for this, we’ve settled on our split view UI, which allows you to annotate one image on the left while seeing your cursor on the right (so you can check if the object already exists or not).
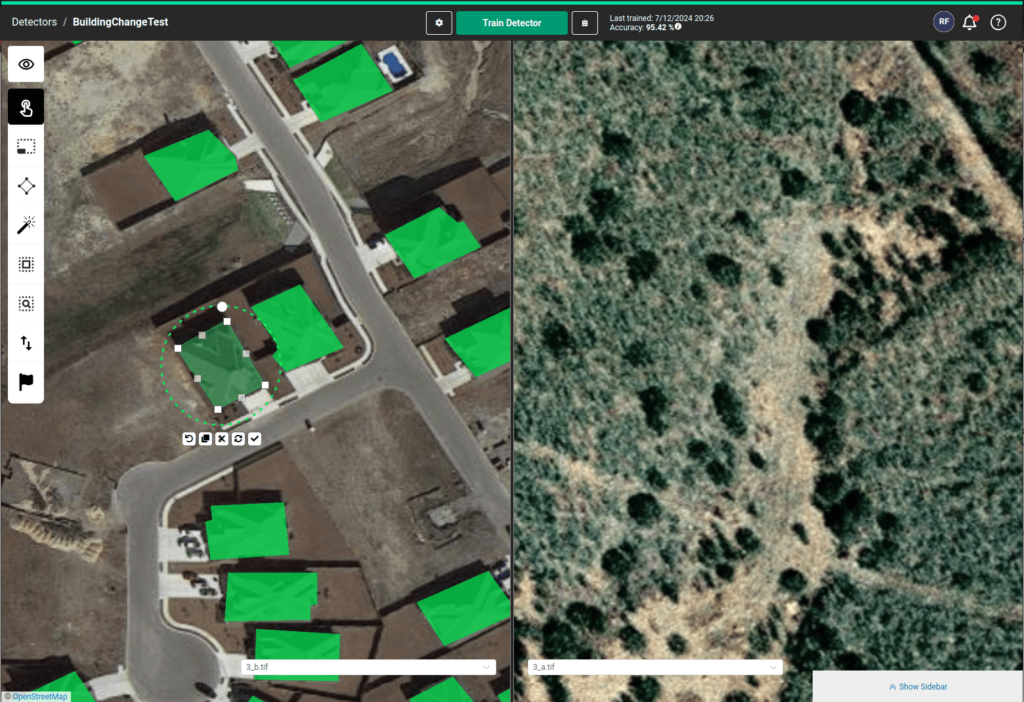
Your training results will also appear on the after image on the left.
Multispectral change detection
To go further, you can also have a multispectral change detection use case. A typical example would be a deforestation use case, where you have RGB + Near Infrared images before and after deforestation. You want to train the model to detect deforestation as a change.
In that case, you can also use the split view to annotate, with the additional feature of selecting which subset of bands from your image you visualize on the left and right sides of your image.
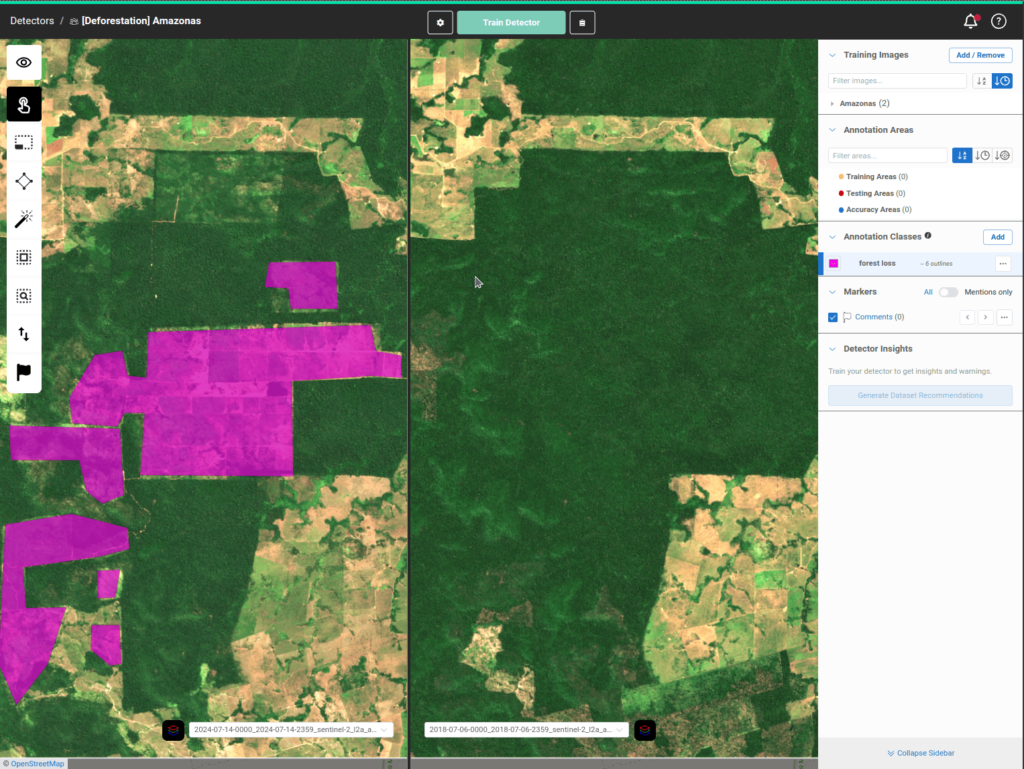
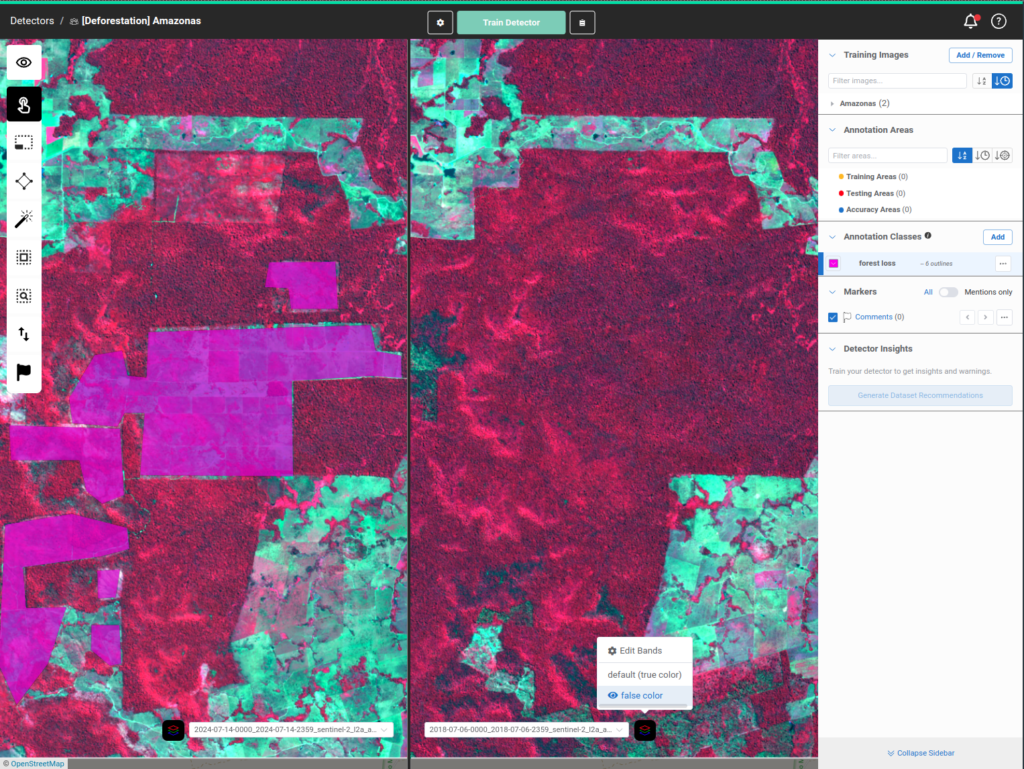
This makes the split view UI very flexible and powerful, allowing you to visualize multiple timestamps in your data and all the different bands you have if you have multispectral imagery.
Machine learning models
Change detection model architecture
From a machine learning standpoint, change detection means you have a “before” RGB image and an “after” RGB image, and you draw some outlines of the areas that have changed between the before and the after.
To correctly train a machine learning model to be able to detect change, you need to be careful about a few things:
- You want to retain the semantic information about what’s before and after so the model can leverage that knowledge to provide better results.
- When applying augmentations during training, you want to be able to augment the before-and-after images separately to increase the model’s robustness.
To cope with the above, one needs to use a change detection-specific machine learning model that doesn’t take just one image as input but actually takes two images and outputs one “change map.” This means the model can rely on knowing what’s before and after and that you can start applying different augmentation to both inputs, leading to a more robust model.
We have explored a number of those models from the scientific literature. After testing on a variety of datasets, we have settled on ChangeStar, which is described in the paper as follows:
“ChangeStar is a simple yet unified network composed of a deep semantic segmentation model and the ChangeMixin module. This design is inspired by reusing the modern semantic segmentation architecture because semantic segmentation and object change detection are both dense prediction tasks. To this end, we design the ChangeMixin module to enable any off-the-shelf deep semantic segmentation model to detect object change. Fig. below presents the overall architecture of ChangeStar.”
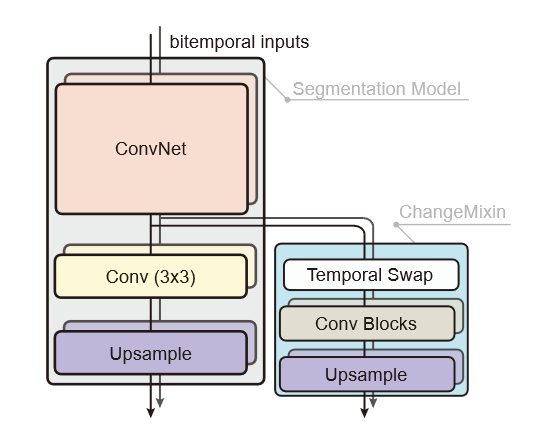
As they suggested, we also use Farseg for the segmentation model. We tested with our own custom model, but Farseg ultimately provided better results.
Citations
- Zheng, Z., Ma, A., Zhang, L., & Zhong, Y. (2021, August 16). Change is Everywhere: Single-Temporal Supervised Object Change Detection in Remote Sensing Imagery. arXiv.org. http://arxiv.org/abs/2108.07002
- Zheng, Z., Zhong, Y., Wang, J., & Ma, A. (2020, November 19). Foreground-Aware Relation Network for geospatial object segmentation in high spatial resolution remote sensing imagery. arXiv.org. http://arxiv.org/abs/2011.09766
A few of the other models we have benchmarked against are:
- Daudt, R. C., Saux, B. L., & Boulch, A. (2018, October 19). Fully convolutional Siamese networks for change detection. arXiv.org. http://arxiv.org/abs/1810.08462
- Transition is a process: Pair-to-Video change detection networks for very high resolution remote sensing images. (2023). IEEE Journals & Magazine | IEEE Xplore. https://ieeexplore.ieee.org/document/9975266
- SNUNET-CD: A densely connected Siamese Network for Change Detection of VHR images. (2022). IEEE Journals & Magazine | IEEE Xplore. https://ieeexplore.ieee.org/abstract/document/9355573
- HANET: A hierarchical attention network for change detection with bitemporal Very-High-Resolution Remote Sensing Images. (2023). IEEE Journals & Magazine | IEEE Xplore. https://ieeexplore.ieee.org/abstract/document/10093022
In our tests, we observed a 3% overall improvement in accuracy across all our experiment datasets and up to 20% improvement on some specific ones. We have also observed that this model scales better with the size of the training dataset. As a baseline, we used a “naive” approach to change where we would just stack the before and after images into a 6 bands image.
The path forward
Change detection is one key enabler of the bigger topic of monitoring use cases. Change detection is always applied here on “only” two images (before and after). Still, when monitoring an area for change over time, you typically want to repeat this analysis regularly when new imagery is available.
This is made possible by the change detection feature we’re making available here: as soon as a new image is available for an area, you can run the change detector, compare it to the most recent earliest image, and detect new changes.
Going down that road opens up new questions around automation: if you’re doing this frequently and at scale, you most likely want to automate this process. This is currently possible through our API, but it is also a topic we want to explore and improve based on what our users are doing with it. This could also lead to supporting time series analysis for change detection down the road, which is an entirely different machine learning approach.