#BeatAirPollution: Create your urban canopy map to raise awareness
The current urbanization rate is taking a toll on air quality. The ever-blooming job opportunities and people’s natural desire for better living conditions have long ignited the strong wave of urbanization. To our day, half of the global population is residing in big cities all over the world. By 2050, according to the United Nations, this number will reach two-thirds of the world. Cities nowadays are overcrowded resulting in many environmental and health issues. Among all, air pollution and the consequent decline of air quality is one of the most harmful and impactful negative effects of the urbanization process.
For people living in urban areas, this decline in air quality can lead to an increased risk of heart disease, lung cancer, stroke, and respiratory diseases such as asthma.
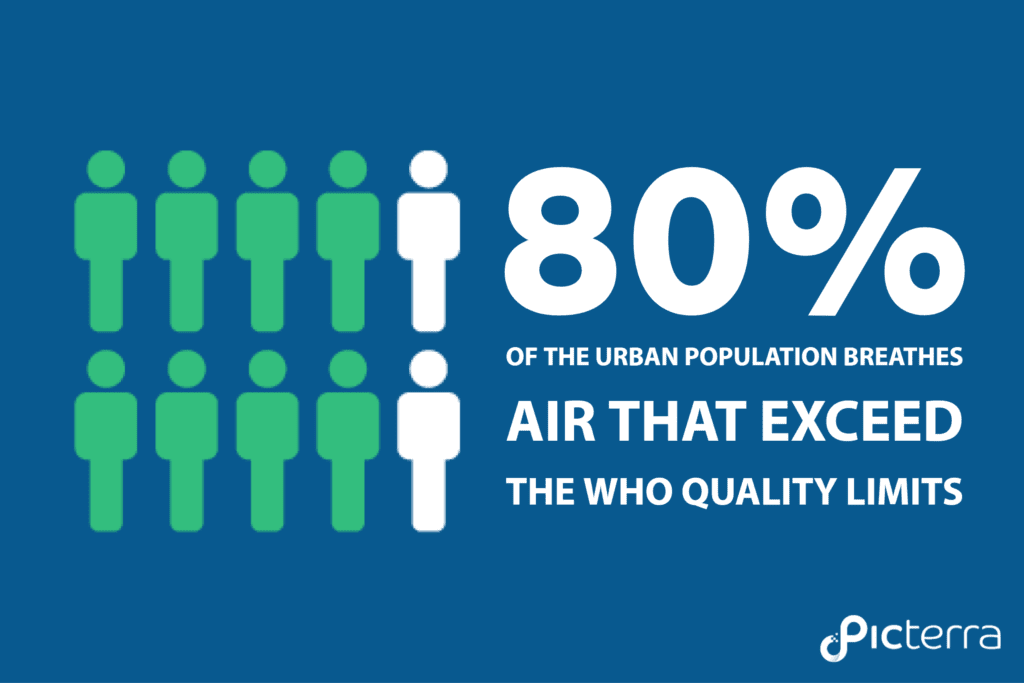
80% of the urban population lives in places with air quality levels that exceed the World Health Organization (WHO) limits
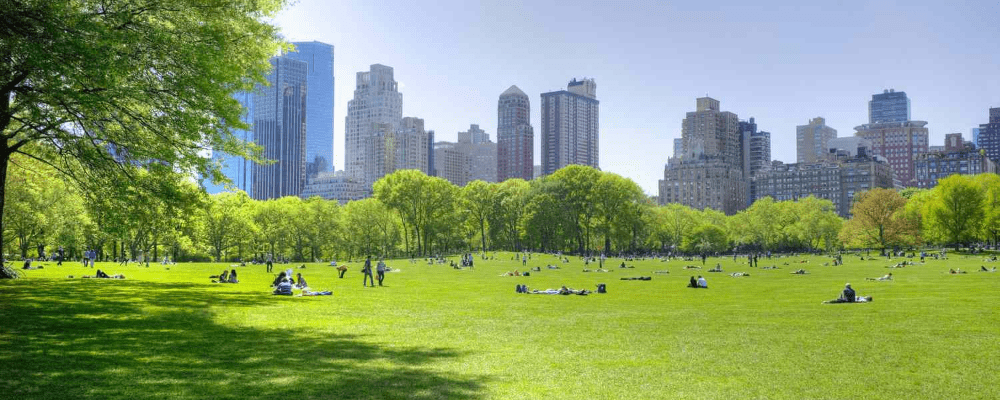
Luckily, air pollution can be reverted. Two main ways to do it are minimizing the amount of pollutants released into the air -by taking advantage of mass transit, walking, cycling, or switching to renewable energy sources instead of driving- and reinforcing the resilience of the urban ecosystem with “green infrastructure”, notably, trees. Trees play an important part in reducing air pollution and improving air quality in cities. Large trees are excellent “filters” for urban pollutants by absorbing polluting gases and treating fine particulates. Strategic tree placement can also help to cool the air and improve physical as well as mental health. Therefore, it is safe to conclude that the value of trees and plants in an urban environment is beyond question, and spreading ‘green’ among the living space is now a mission for cities around the world.
So, how green is your city?
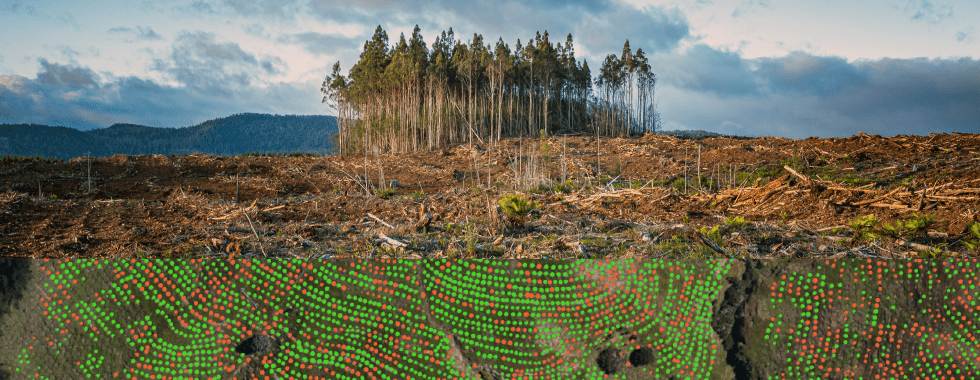
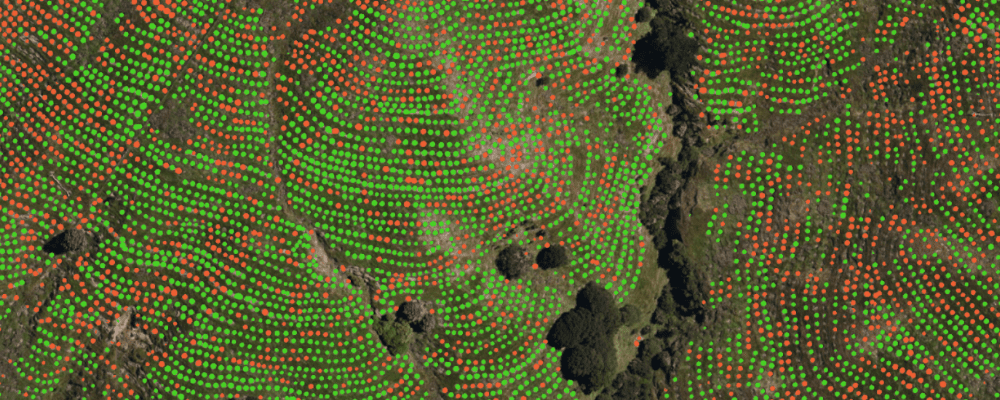
Urban canopy maps are visual representations of the location and extent of the tree cover in a city.
One of the methods to produce them is the top-down remote sensing approach which implies analyzing satellite or aerial images and extracting the trees as an information layer.
Applying this concept, National Geographic created maps taking a look at tree coverage in nine of the largest cities in the U.S. in a feature entitled, “Nine Cities That Love Their Trees”.
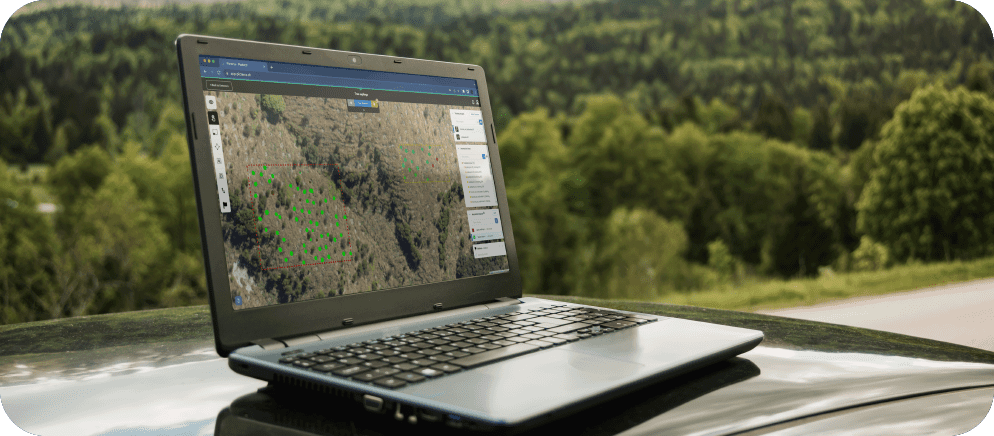
You can do the same and create your own canopy map and check how to green your neighborhood -or your city- is. It may sound complicated, but it’s actually not. All you need is an aerial image and the right image analysis tool.
Let’s create an urban canopy map
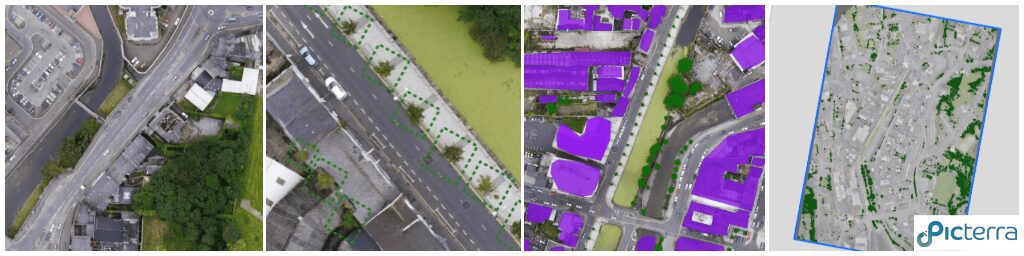
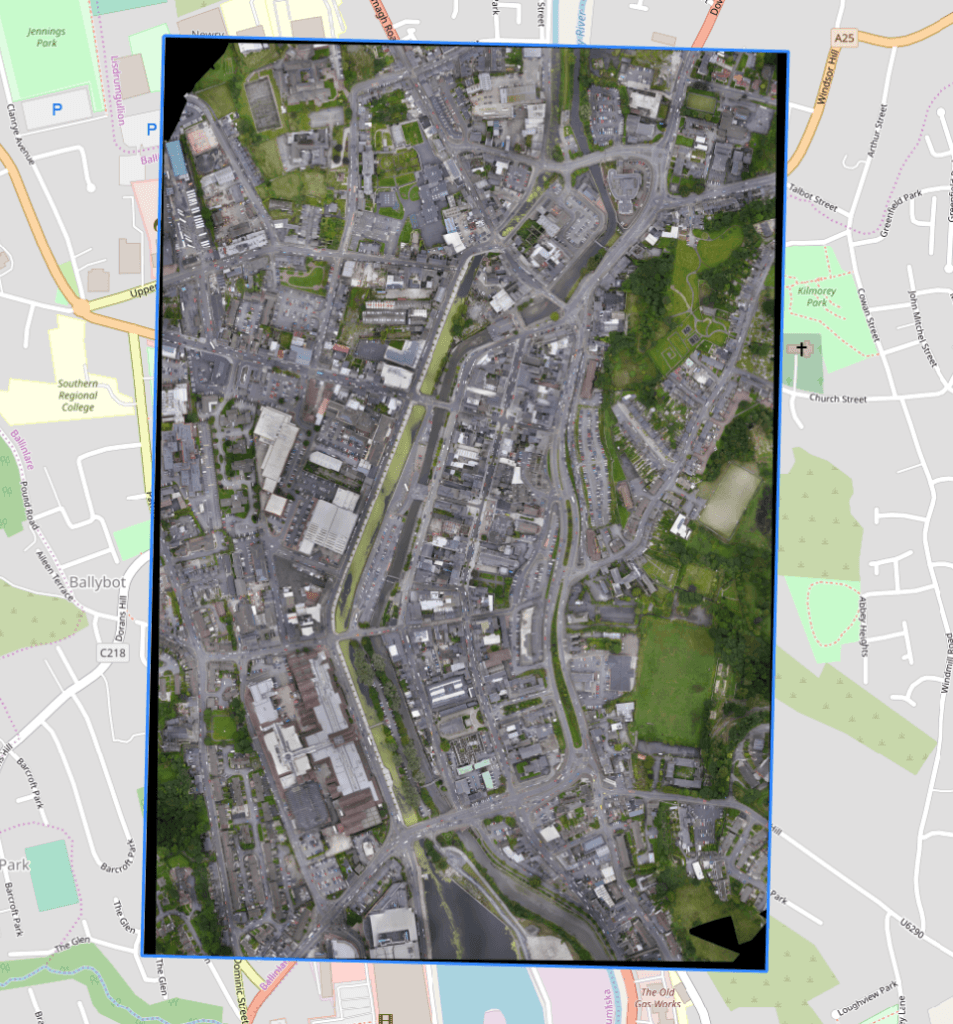
In this project, we analyzed an aerial image of an area located in Newry, Northern Ireland -the orthomosaic was produced by OpenAerialMaps contributors-. You can get started by uploading your own orthomosaic to Picterra.
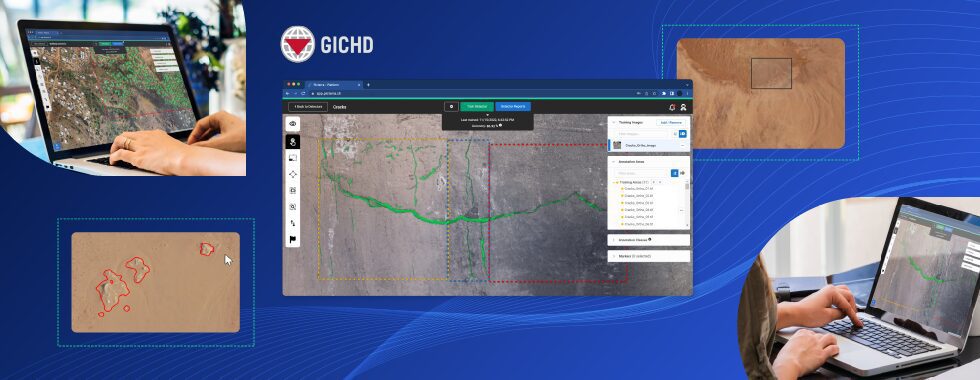
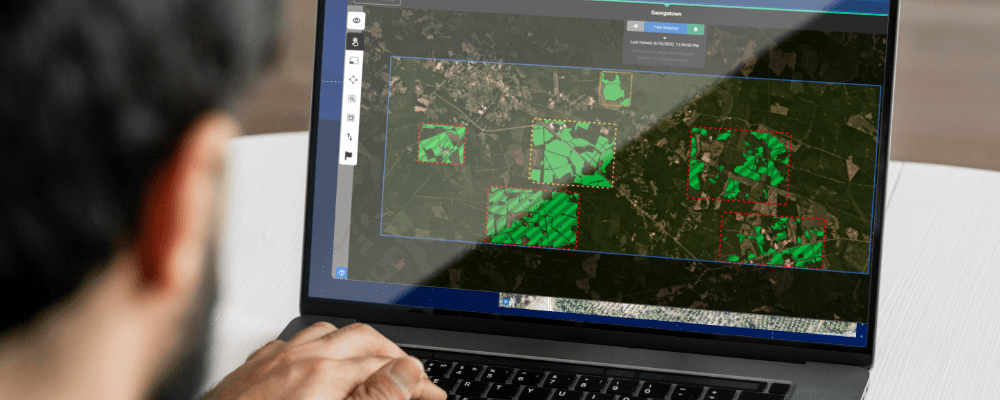
Build a “Tree Detector”To go one step further and compare the extent of canopy cover with the area covered by buildings we created “Buildings Detector” following the same steps.
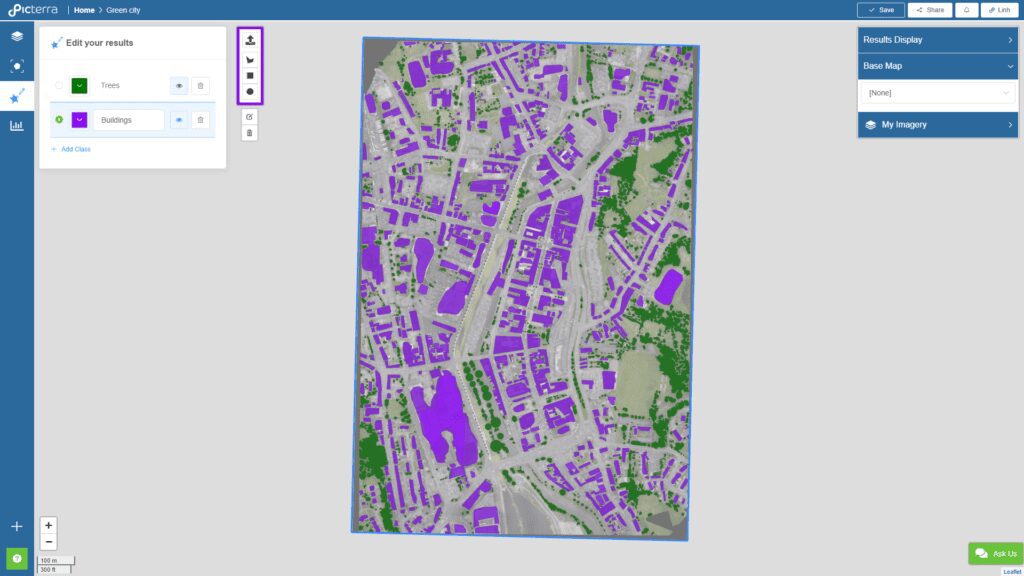
Visually, this is what we got, the trees and the buildings here are displayed in 2 separate layers. You can check the project here: http://bit.ly/2JYPTuD
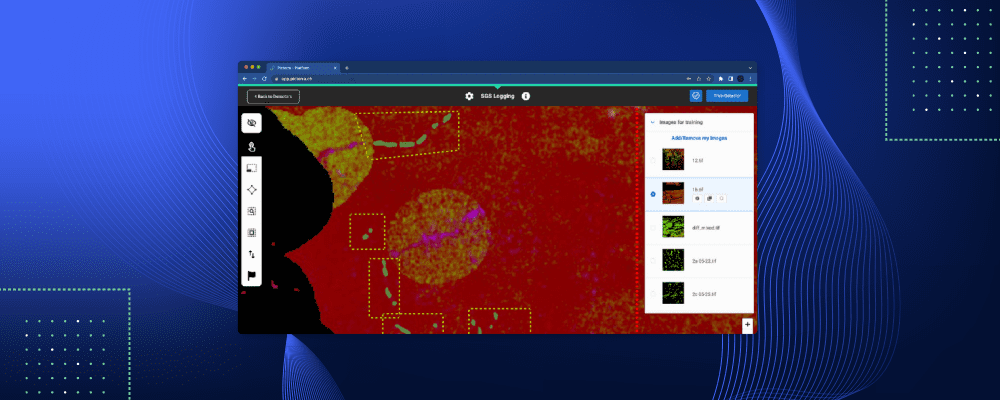
The next step is deriving quantitative information from object detection. To do so, we selected layers and defined the area we wanted to report on.
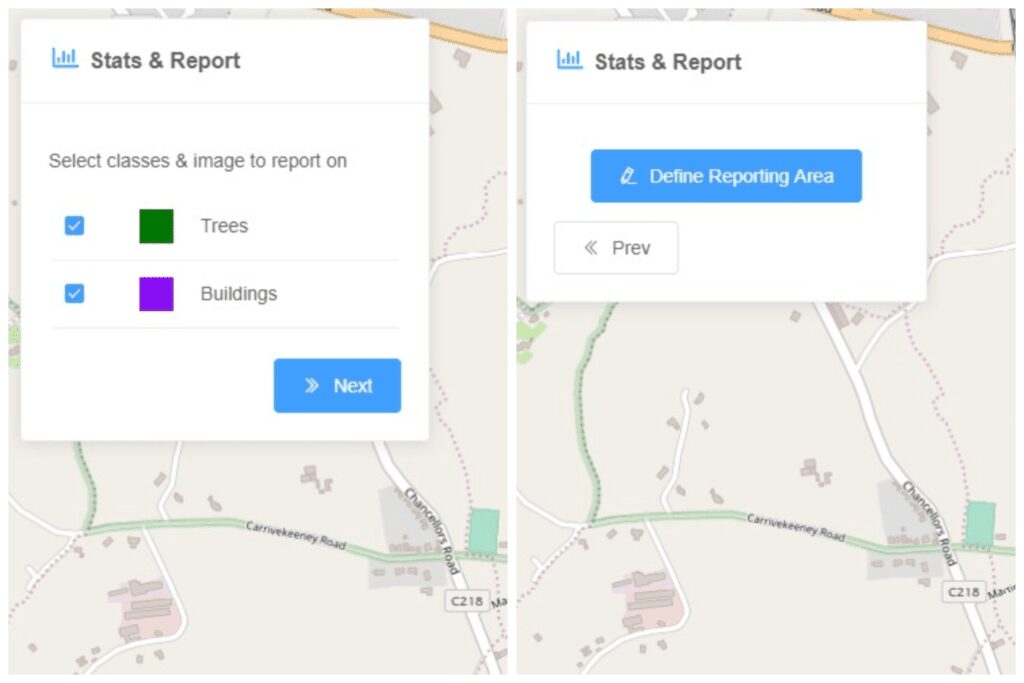
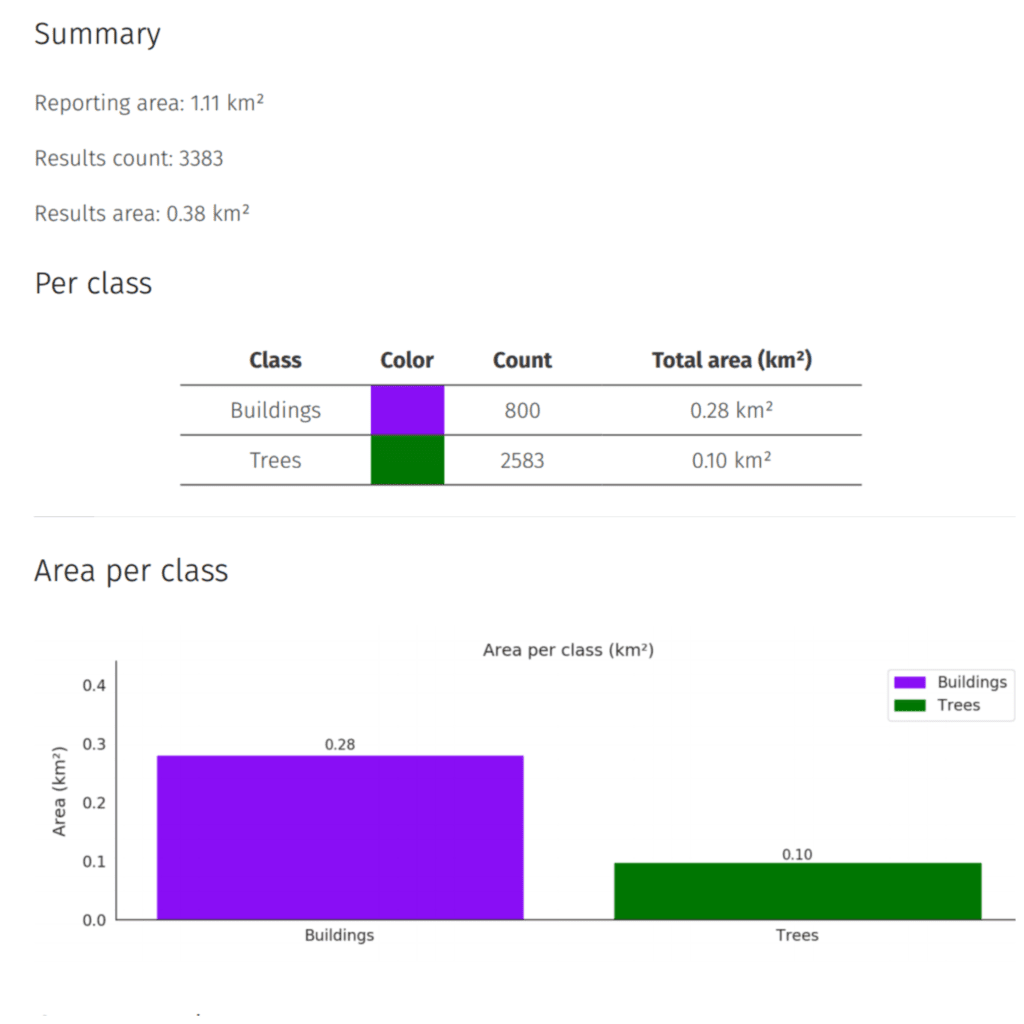
The information reported:
- The tree canopy is around 8.9% (0.10km2) of the whole area (1.11km2)
- The buildings cover around 25% (0.28km2) of the whole area (1.11km2)
- The building area is approximately three times higher than the tree canopy in this area of Newry.
Based on such an analysis a city might want to consider incorporating additional green infrastructure to favor a more sustainable and healthier environment. It can also track over time the impact of policies and actions made for the protection of the environment.
Make a real-world impact: create maps and stats to raise awareness
Raising public awareness on an issue involves creating the right messaging. Maps and stats can be used to present hard data on an issue in a compelling, visual and user-friendly manner.
Create and share your own urban canopy map and play a role in improving air quality, mitigating and adapting to climate change.