Keeping track of population in rapidly changing areas can be challenging, but is key to efficiently plan infrastructure or urban development.
During a humanitarian crisis, urban and infrastructure planners —working in an NGO or a local government— need fast, accurate and periodic population estimates.
This information is key for planning basic infrastructure and services to “ensure planned settlements enable refugee communities to live with security and dignity in a healthy environment which improves their quality of life.”— citing the UNHCR Emergency Handbook.
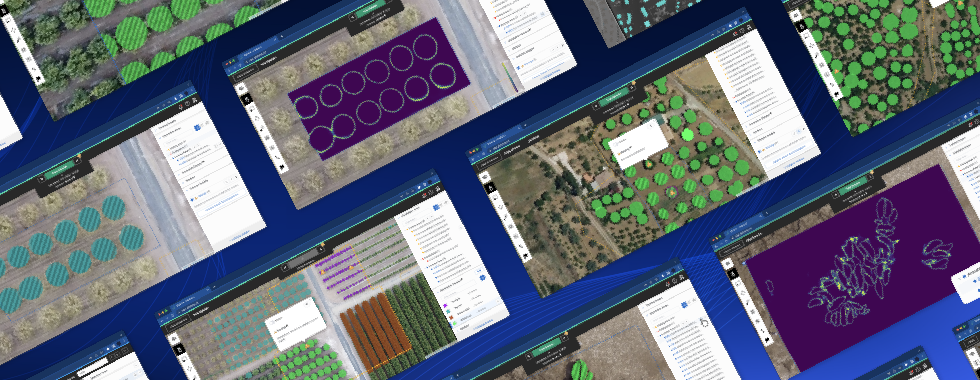
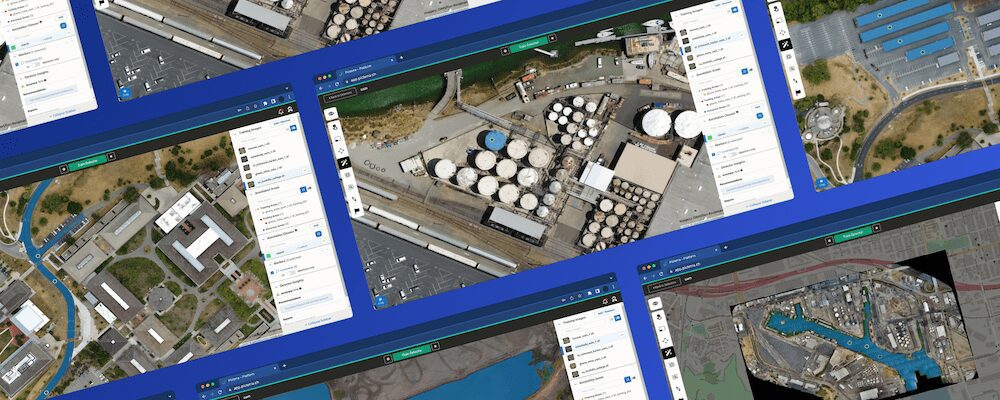
In this context, aerial or satellite imagery can be a valuable resource to extract this information. In this example, we’ll see how we can use the Picterra Platform to quickly detect shelters on an image of a settlement.

This particular camp is of the Kalobeyei Settlement located near Kakuma in Kenya. The image was taken by OpenAerialMap user Tayyar Sukru.
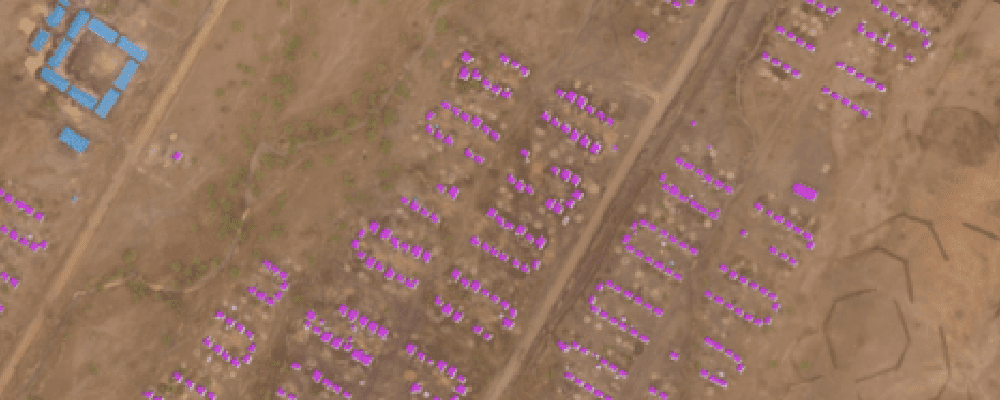
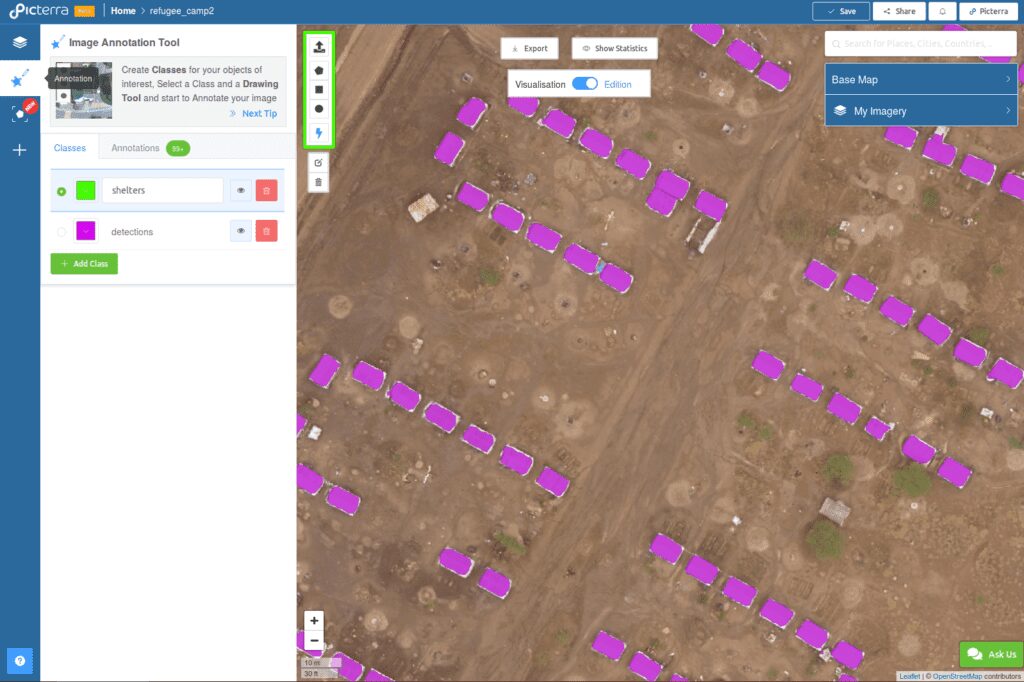
This is what the image of the whole area looks like. There are quite a few shelters in this image, so counting them manually would be time-consuming.
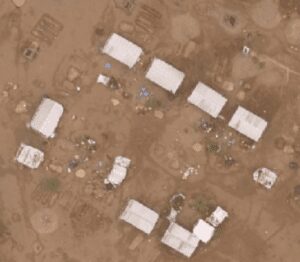
Zooming in a bit, that is what the shelters we want to detect look like:
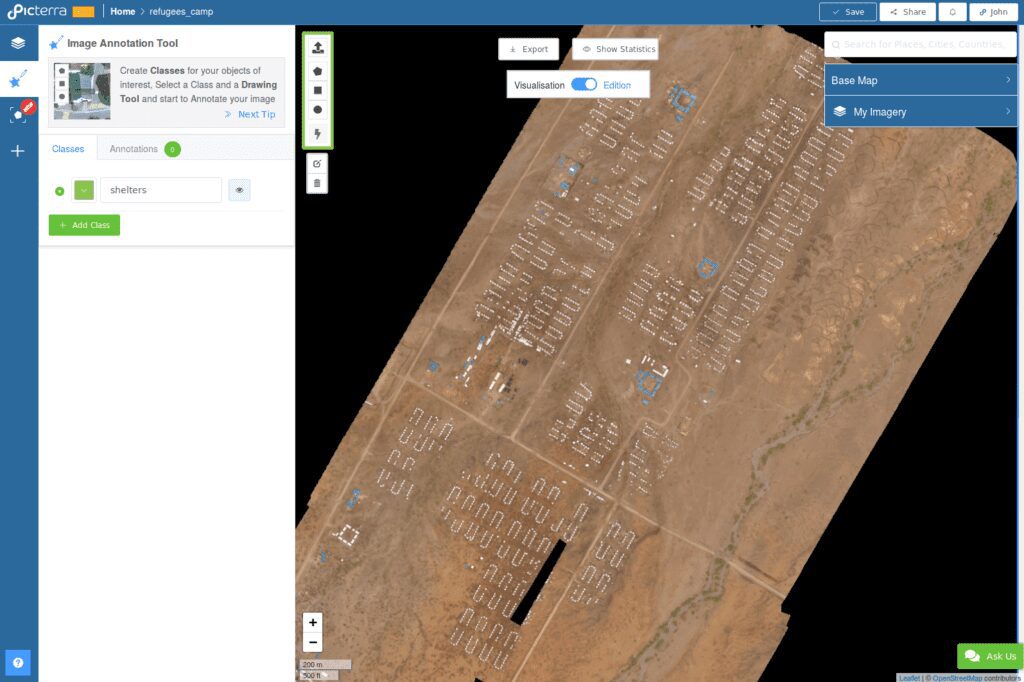
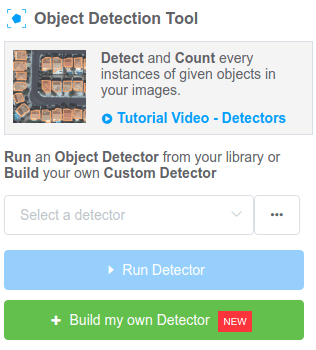
In order to build our shelter detector, we will use the ‘Custom Detector Builder’ tool from the Picterra Platform. To open it, go to ‘Object Detection Tool’. Then, click on ‘Build my own Detector’
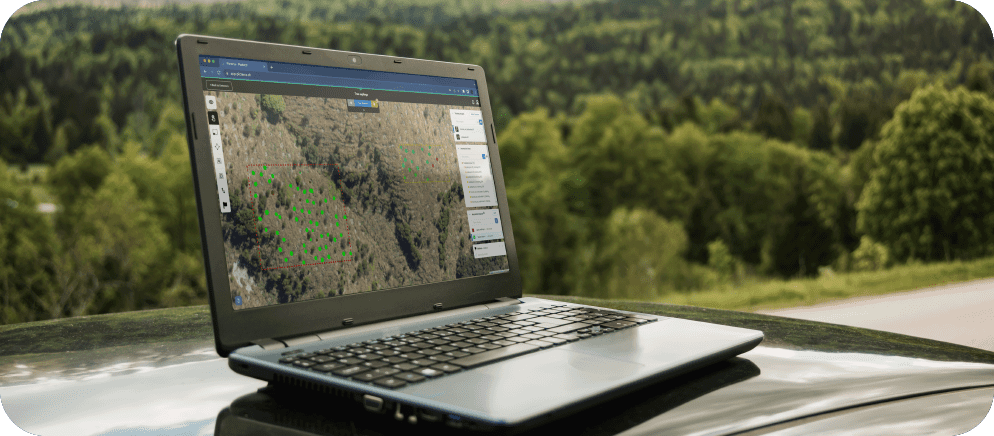
The first step to create a custom detector is to define “training areas”. Training areas are regions of the image that Picterra’s AI model will use to learn about the type of objects we want to detect (shelters in our case). One important rule when defining training areas is that we make sure we annotate every object of interest —all of them— that appears in a training area.
For this image, we chose to define multiple training areas :
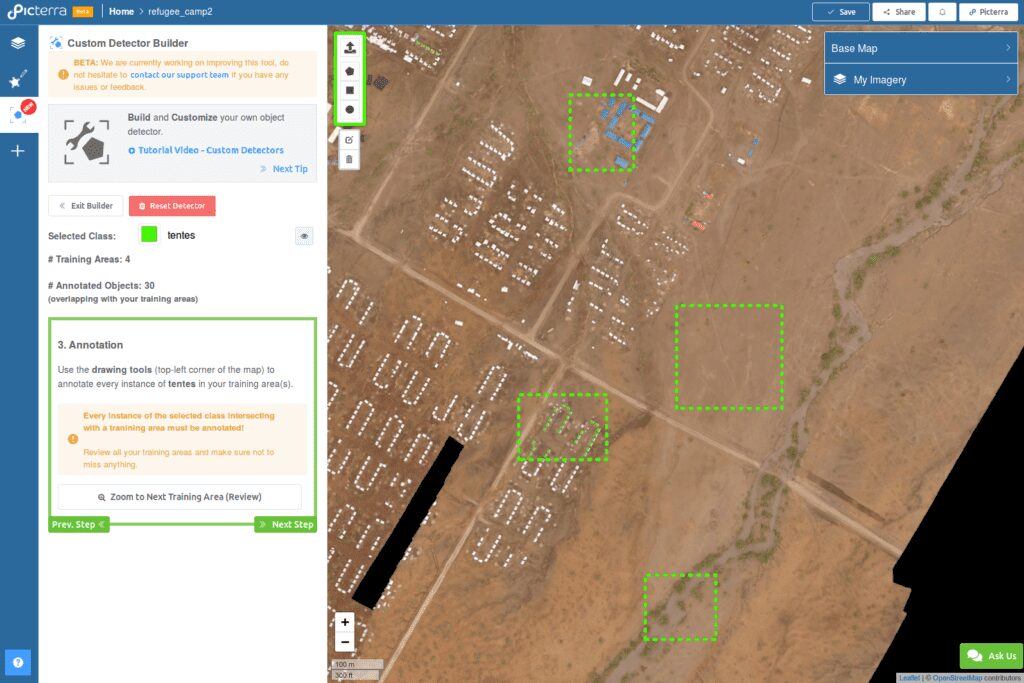
You can see that we selected various regions as training areas. There are three ways to think about training areas :
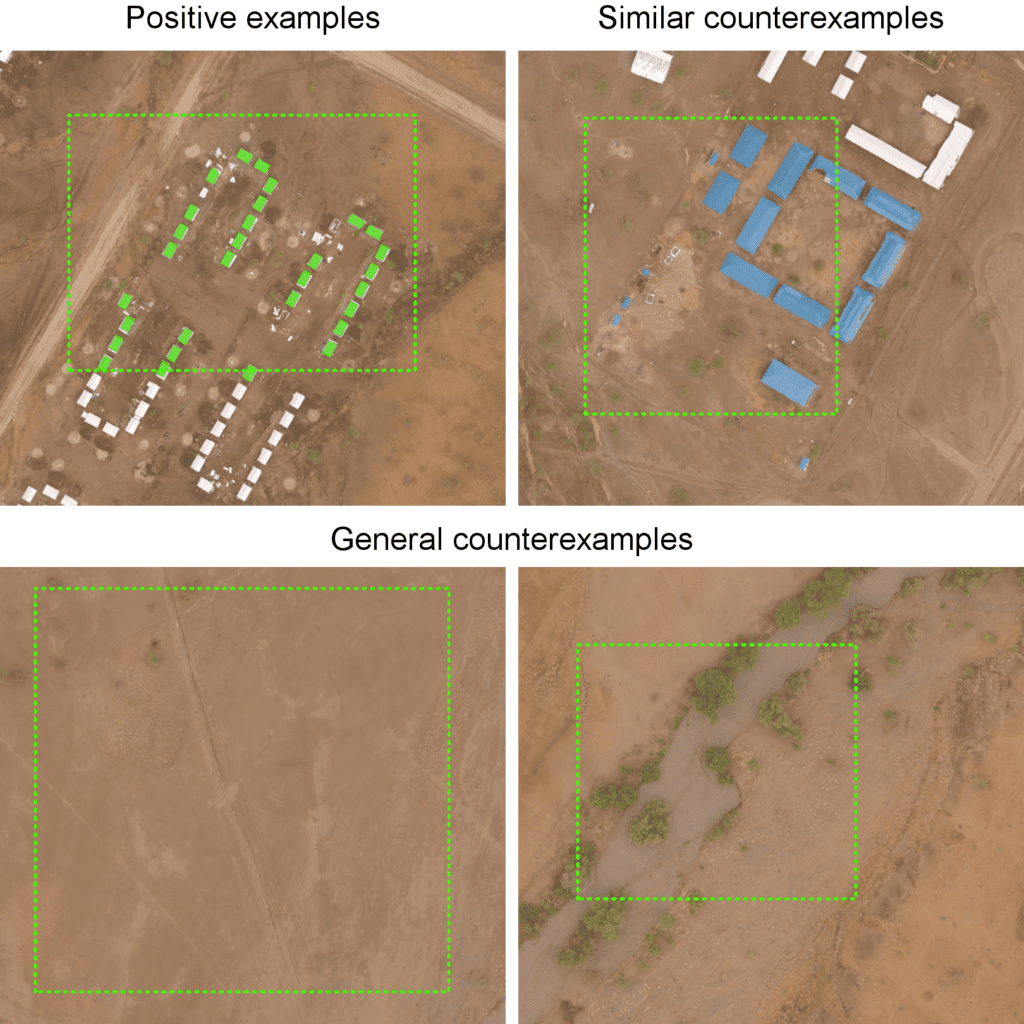
- Training areas that contain examples of shelters (positive examples). This teaches the model what to detect.
- Training areas that contain examples of structures similar to shelters but that are not shelters (similar counterexamples). This teaches the model what not to detect.
- Training areas that are empty and just contain “background” (general counterexamples). This teaches the model what background looks like.
To create a good custom detector, it is important to have a bit of each type of training areas. The most important is the training areas containing ‘positive examples’ of objects to detect.
Now that we have defined training areas and annotated examples shelters in one of them, we can train and run the custom detector. This should take a few minutes and then we get detections over the whole image :
Zooming in, we can see that the detector got the shape of the shelters, which means we can use the detections for area computation :
If these first detections were not good enough, we could improve the Custom Detector by adding additional training areas and annotations.
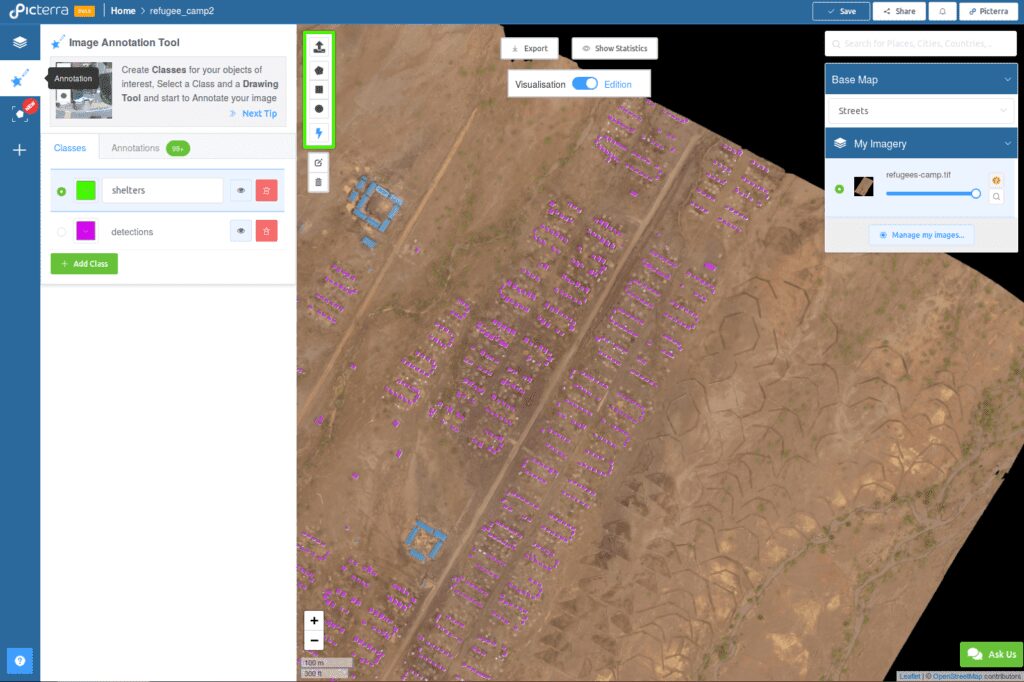
In this case, we are happy with these first detections, so we will import them back in our Annotations Map by using the ‘Save/Export’ option at the end of the Custom Detector.
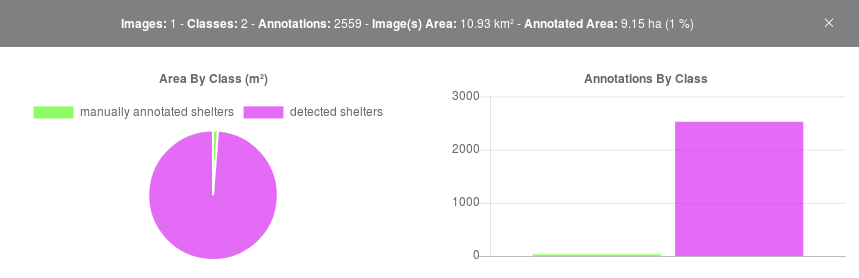
In the Annotations Map, we can use the stats panel to get quick statistics about the detections. From this, we learn that the shelters cover about 90000 m² and that there are about 2500 shelters. These statistics can be used to update maps about the settlement and to cross-check population estimates for example.
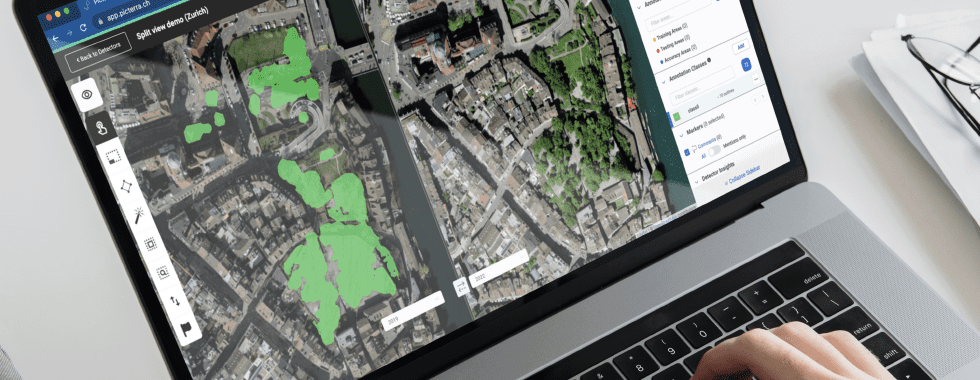
If you want to conduct more advanced analysis in a GIS software (ArcGIS, QGIS, …), you can easily export the data from our platform in multiple formats (GeoJSON, Shapefile, CSV).