Trends in Earth Observation: Acquiring and Analyzing EO Imagery
Despite the massive amounts of archival and new EO data available, acquiring it is still painfully difficult for most organizations. First, it requires some knowledge of the types of data available and of the data providers, as well as some understanding of which types and sources of data best meet the requirements of a project. Second, when the data available for free does not meet these requirements, purchasing data from one of the major operators of EO satellites often requires a lot of patience, negotiating skills, and a large budget.
Fortunately, Picterra’s platform, which is mostly focused on enabling users to train models and use them for detection, also facilitates their acquisition of satellite imagery from various sources. Additionally, Picterra is developing ways to make it increasingly easier for large companies to use their existing, in-house datasets—for example, a cadastral company’s tens of thousands of building footprints—and integrate model training and object detection into their existing workflows. One way Picterra is doing this is by developing APIs and other automatic ways to ingest training data into its platform.
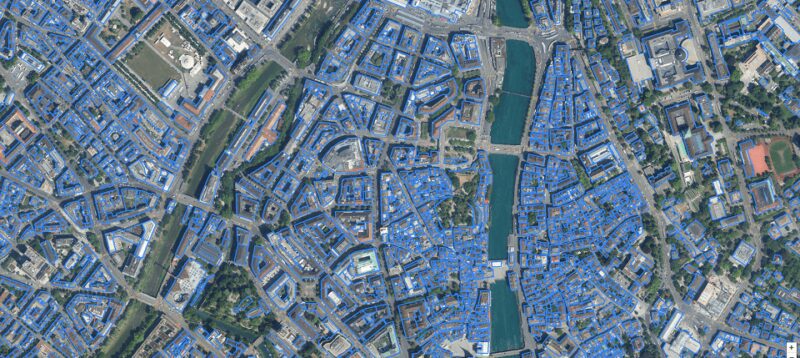
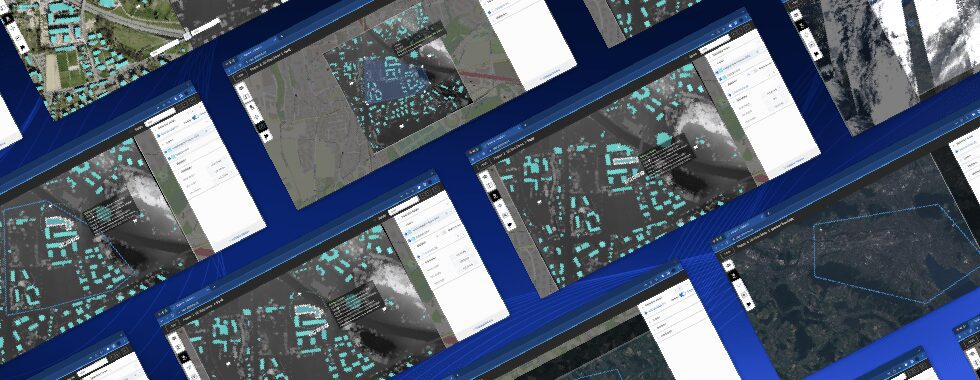
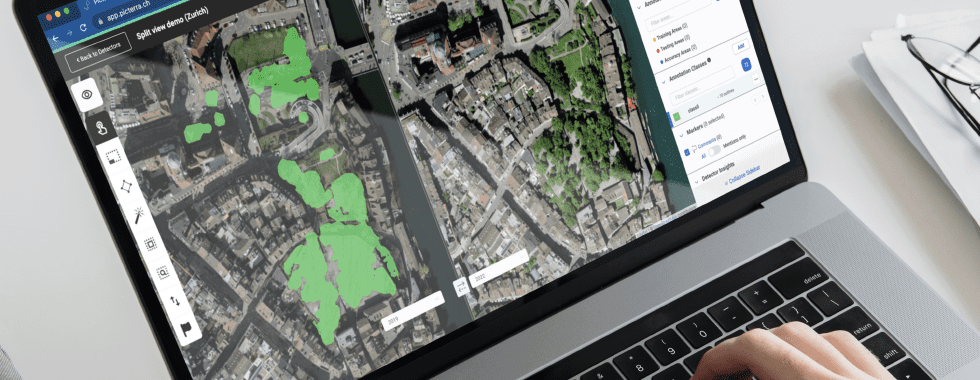
An aerial image of Zurich with building footprints.
Once they have acquired Earth Observation data, organizations can still find it a daunting task to use machine learning to analyze it. However, this is becoming increasingly easier, cheaper, more accessible, and more efficient to do, making it even more feasible for government agencies, businesses, and scientists to take full advantage of satellite imagery. It shouldn’t come as a surprise that machine learning is one of the most promising trends in Earth Observation. Picterra’s platform greatly facilitates the analysis of EO data by providing reliable and easy-to-use tools for training and using models.
Machine Learning Challenges
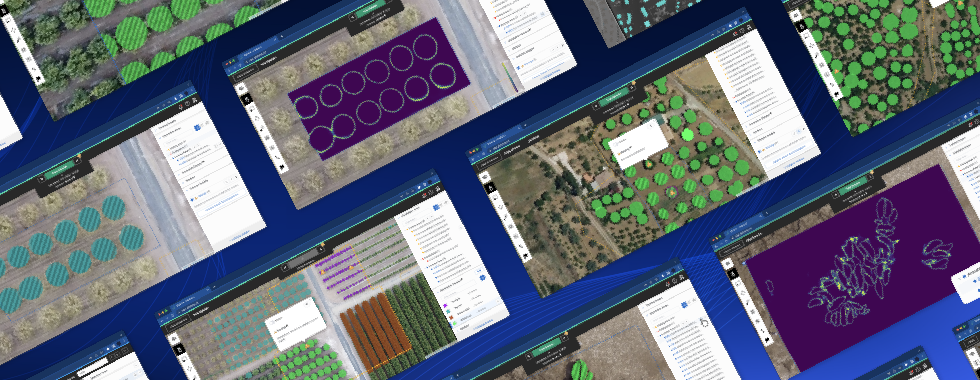
Automatic feature extraction using ML works by training models to identify the objects of interest—such as cars, houses, or center pivot irrigation systems. To train the models, users need to manually outline hundreds or thousands of instances of the object of interest to them. These models rely mostly on an object’s texture (its color and contrast) to detect instances of it, as well as on its shape and size. Therefore, it is easier for models to detect some objects than others. For example, it is easy for them to detect swimming pools because they are blue and bordered, in general, by grey.
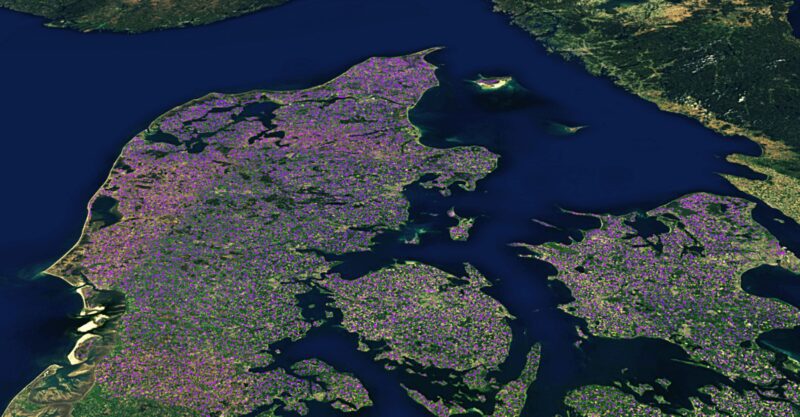
An example of a country-scale detection: 26.000 objects detected with only 56 training annotations. For more information, visit https://old.picterra.ch/blog/press-release-country-scale-detection/
Currently, one of the biggest challenges in ML is to develop the ability to build models by pooling data from many users. “If we have 20 users doing weed detection,” says Julien Rebetez, Picterra’s Lead Software & ML Engineer, “how can we pool the information from all of them into a smarter model? We have made some progress in that direction, but it is still a very challenging problem from an ML point of view, because each user’s data are always slightly different from those of other users, so you need to reformat them a bit. It involves a lot of trial and error.”
Those 20 users doing weed detection, Rebetez points out, might not all define “weed” the same way. Additionally, weeds look different depending on the type of crop. “So, if one user identified a plant as a weed and another user does not think it is a weed, the model will have confusing annotations,” he explains. “This is super hard to detect automatically, without manually validating the data. So, the main challenge is ensuring the quality of user-generated data.” Additionally, imagery from different users will have different resolution, illumination, color, etc. Therefore, models will always need further training to work best for each client and project.
Another ML challenge is called generalization. “For example,” Rebetez explains, “when you train a model on a city, how well will it work on another city that is slightly different and using images acquired at a different time of day? This is quite a challenge in ML in general. It’s not a problem when you train a model on a very specific set of data, but when you try to apply it to something slightly different the training becomes tricky.”
A third ML challenge is to develop the ability to detect important change directly by ingesting multiple images—say, all the images of an area taken over a six-month period—rather than by analyzing one image at a time.
Trends in Earth Observation: Real-life Applications
To address the challenges mentioned above and continue to improve its platform, Picterra’s R&D is moving in three directions that reflect trends in the larger EO image processing industry.
The first trend is to address the challenge of imagery pooled from multiple users by developing “base detectors” that can then be finetuned, with additional training, by each user. The Holy Grail would be a pool that keeps growing, covering all the different combinations of resolution, view angle, sun angle, etc., so that it can work for many different users. However, this vision currently bumps up against a phenomenon that ML engineers and researchers call catastrophic forgetting: models usually “forget” their previous training when presented with a somewhat different version of the same feature. For example, a building detection model trained on European houses will start to fail when presented with houses in the United States. We have explained it in detail in this blog post about detecting buildings.
The second trend is the increasing automation of monitoring—including developing models that can provide better change detection by ingesting and analyzing historical data. Picterra already enables its users to subscribe to imagery, such as from its partner company SkyWatch. For example, users can request daily imagery of certain areas and Skywatch will arrange to deliver that imagery daily to their Picterra account. Furthermore, users can train a detector to detect some kind of object—say, parked cars—and set it to run automatically every day to analyze the latest imagery and generate a report with the information they need. However, change detection is currently still performed by analyzing one image at a time. Analyzing multiple images will be “the same kind of architecture that is used to track objects in video,” says Rebetez, “because it will not only use one frame but also the past frames.”
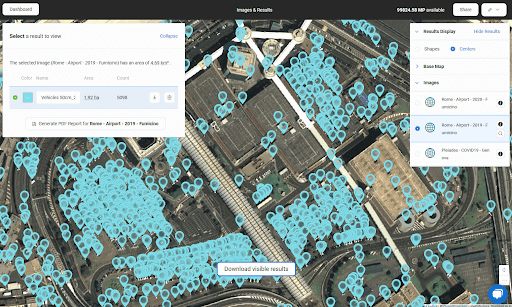
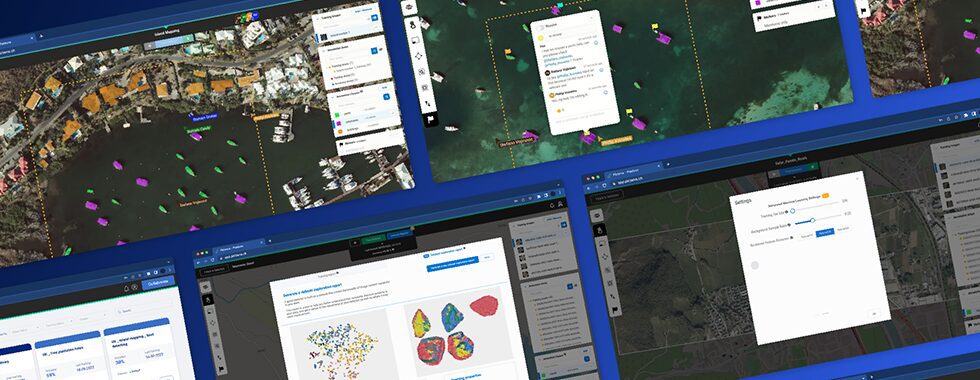
Vehicles detected at Rome Fiumicino Airport parking in 2019. Contains modified Pléiades data processed by Euro Data Cube
A third and emerging trend is to develop models that can analyze different kinds of data, such as from infrared (IR) and synthetic aperture radar (SAR) sensors, which many of the EO satellites now in orbit collect, and from digital elevation models (DEM). This is because much of the ML currently in use to analyze satellite imagery was developed to analyze only optical red-green-blue (RGB) data. “SAR data is super expensive now but it is becoming cheaper and cheaper with new companies launching SAR satellites, so it will become a common data source that you will need to be able to process,” says Rebetez.