How you can create a custom detector
Using the Picterra platform, anyone can access and utilize our Machine Learning (ML) models easily, with absolutely no prior knowledge of AI or Data Science. The platform requires no coding skills and you don’t need to be a technical expert. To create an ML model detector, the first step is to teach your custom detector what you see, where the relevant information is, what you are looking for, and also what you are not looking for. Let’s explain how you do it step by step.
Upload images
After having created an account, you need to upload images of your project. It can be uploaded in multiple formats (.tiff,.tif, .png, .jpeg) with a maximum size of 10 GB. A second option with the platform is to upload satellite imagery from Mapbox.
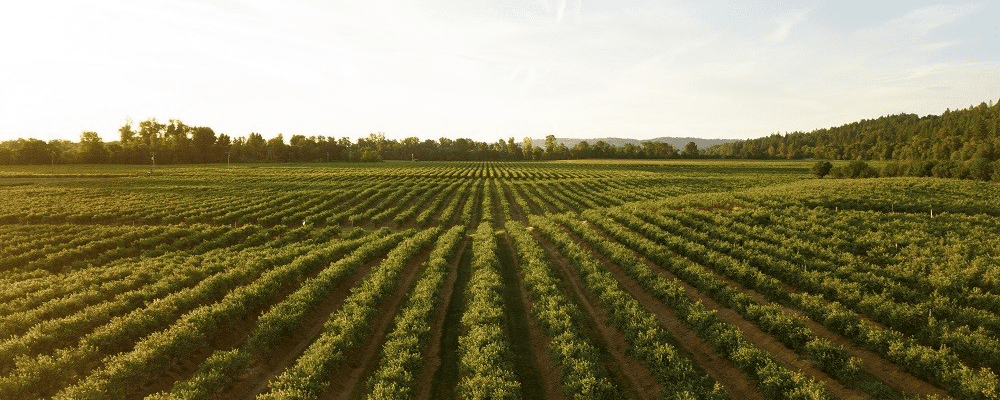
In the case of our coffee producer, the pictures are produced by drones with a resolution of 5cm, in .tif format. These images are then uploaded onto the platform.
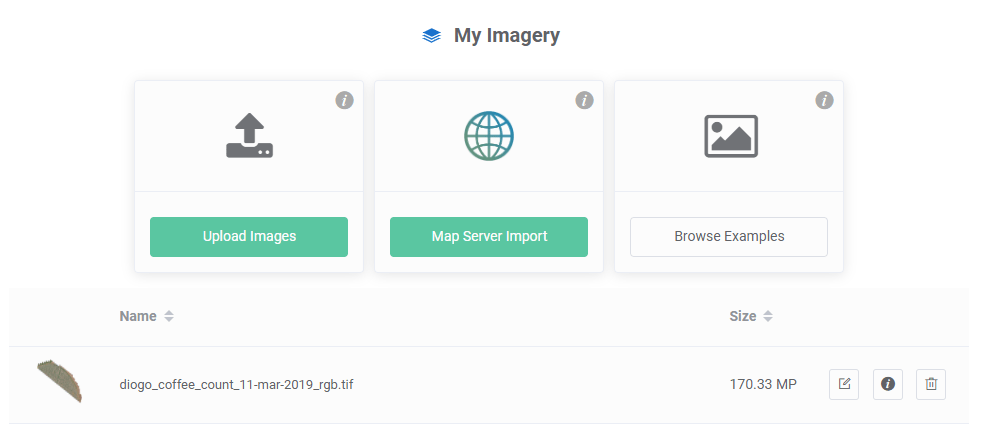
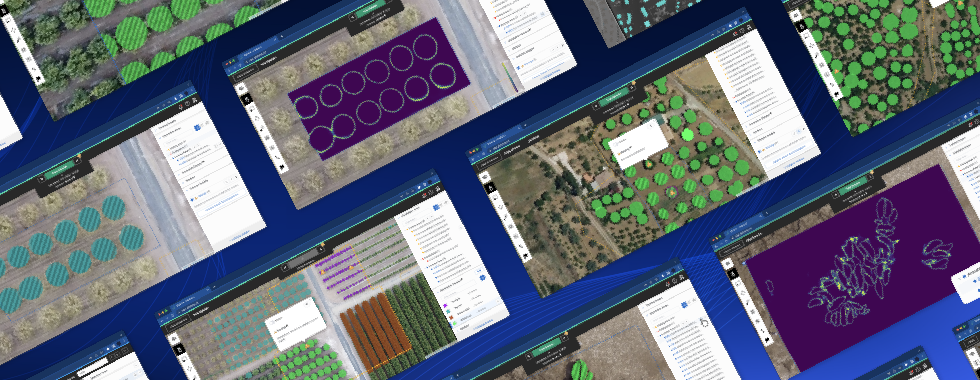
Figure 1: Imagery library of the project
Train the detector
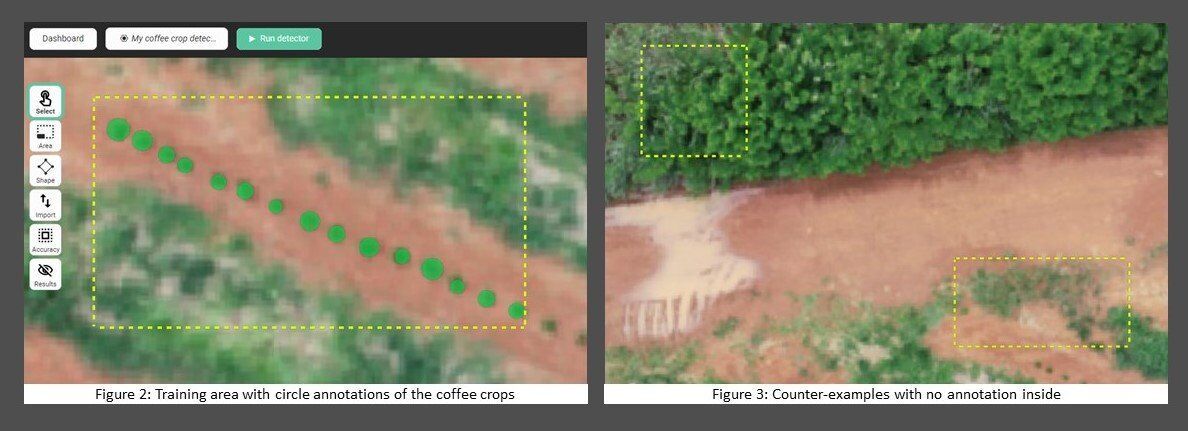
The next step is to create a detector for your use case. Each detector is customized and trained by the user to fit their needs. First, the user indicates to the detector where the relevant information is by drawing training areas. The detector will focus on, and train itself with, information inside these areas. Within the training areas, the user annotates every object that he is looking for, without missing one. The Information which is not annotated inside the training areas is segmentized as non-wanted objects by the detector.
For coffee crop detection, the producer creates a training area with about ten crops. Then, he annotates the crops with circles. In order to improve the accuracy of the results, the producer adds some counterexamples with similar colors. This means highlighting training areas without annotation. It indicates to the detector what the producer is not interested in, such as the forest or the grass.
Iterate the process
Then, the user runs the detector model for a first iteration. The results need to be reviewed to conclude if the detector is performing well. The results will depend on the information given – the training areas and the annotations – and from the diversity of features within the pictures. Thus, the more information you give to the detector, the more accurate it will be. Then, images with lots of different colors, textures & sizes of objects might need more attention and multiple iterations to get accurate results. Consider that if the objects are easy to distinguish by eye, the detector won’t have any difficulty. After each iteration, the detector can be improved by adding more training areas and annotations. Read our article on sheep detection to follow a complete iterative process example.
The case of coffee crops is not complicated and crops are quite easy to distinguish. The first results are already very good. However, to get accurate results on the others, the producer adds a couple of additional annotations of crops and a few more counter-examples.
Get the results
The final results can be downloaded in the format wanted and added to GIS (Geographic Information System) software. It is also possible to generate a .pdf report of the results to include in your project.
The detector is ready to be spread to the entire project and runs on other images. After having invested some time to create a detector, you can deploy it on every image you want with one click, saving you a lot of time.
Want to learn more about custom detector creation, and how it can help your project, save you time and reduce your cost?