Picterra and Hexagon Aerial Imagery
Hexagon provides both 30 cm resolution imagery across the entirety of the United States (and selected regions of Europe) as well as 15 cm resolution data across more urban regions. In addition, they provide both RGB imagery as well as CIR imagery, which is handy for things like detecting vegetation. Using a combination of Hexagon’s imagery and Picterra’s machine learning based platform you can truly perform your geospatial mapping and/or counting needs anywhere in the country or even across the entire country if need be!
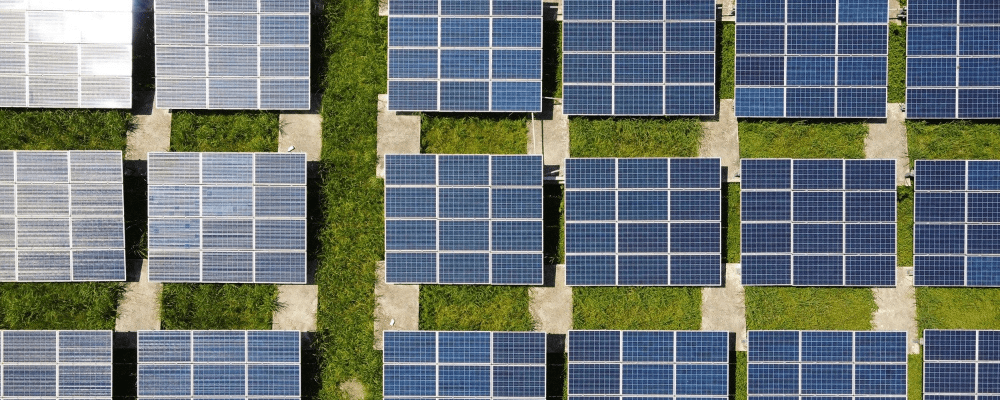
In this post, we’d like to demonstrate what can be done for renewable energy monitoring with an aerial image at large scale. The example we’ve chosen to show is detection of solar panels across a large 5000 sq km region just above Los Angeles, which for reference is an area larger than the entire state of Rhode Island (admittedly the smallest state, but hey, still a whole state!). This region is home to the various wind and solar farms such as Alta Wind Energy farm and Avangrid Renewables. Our goal will be to detect and map all of these assets in this large area, focusing on Solar Panels. The sheer amount of renewable energy sources in the region is just incredible and serves as a powerful demonstration of the scale of what you can achieve using aerial imagery and the Picterra platform. Here’s what the region looks like on Hexagon imagery:
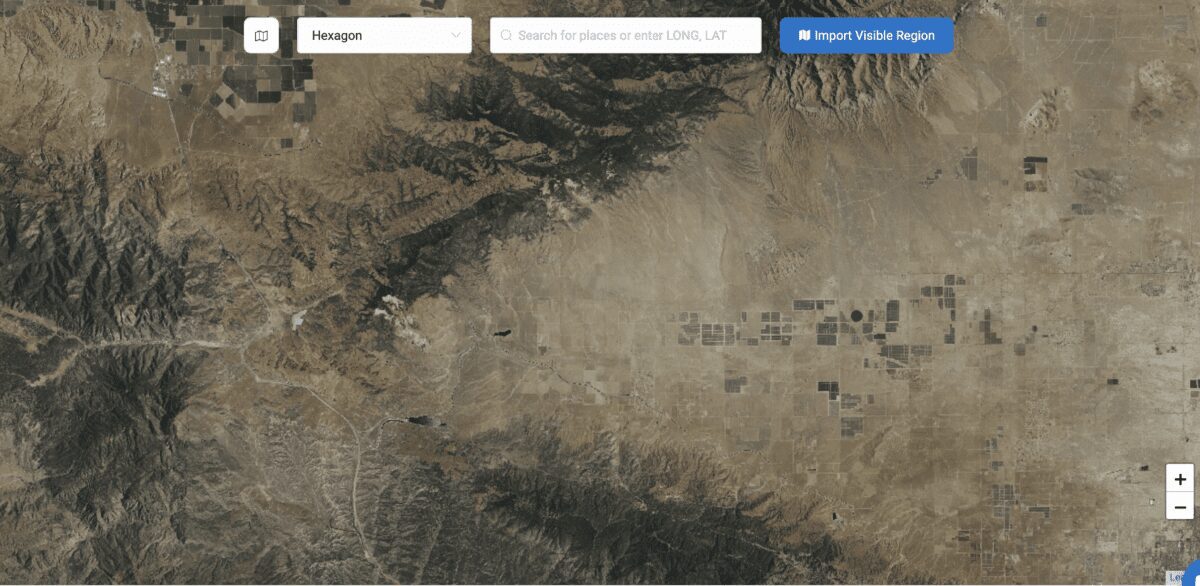
An area covering about 5000 sq km over which we will detector solar panels using Picterra
Renewable Energy Monitoring: The Process
The first thing to do in renewable energy monitoring is to train a Solar Panel detector on Picterra. It’s important to note that the total time spent manually creating annotations for training was less than an hour. The focus of this blog post will be detection at scale so we won’t go into details about the actual training process and instead we’ll show how we took that small amount of work and easily turned it into creating localisations of tens of thousands of solar panels across this region!
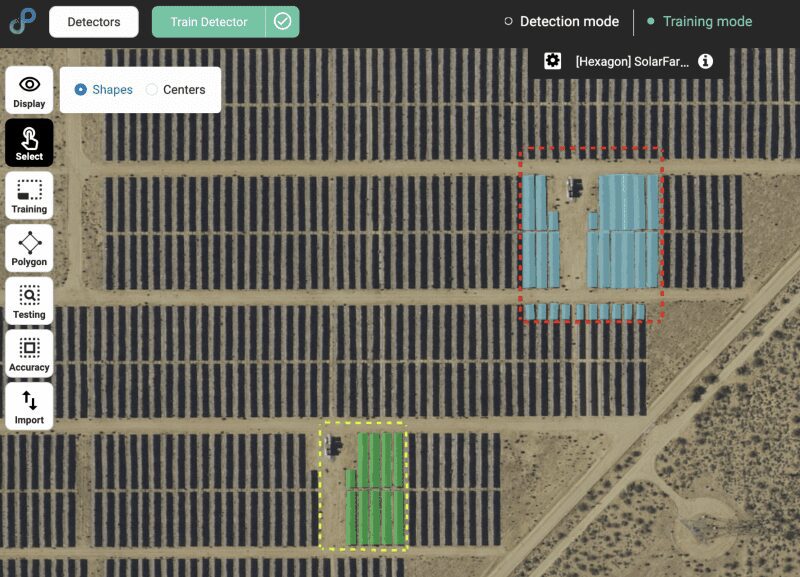
A sneak peek into the detector training interface of Picterra. In green, some annotations. In red, some test detections.
The first step is to define your region of interest in your imagery. In the case of solar panels, it takes no time to quickly scan your image to look for the subset of it that you are most interested in processing, the challenge is to actually map them. We realised that the solar panels we are interested are mainly in the central part of the valley and so in fact we do not want to process the entire image. We can do this using a feature on the platform called Detection Areas in which you can specify a subset of your image to use for processing. This is beneficial in a few ways: your detection will take less processing credits in the platform than running on the entire image, your detection will take less time, and you also don’t risk getting false detections outside your area of interest. In the Picterra platform, the detection area looks like this:
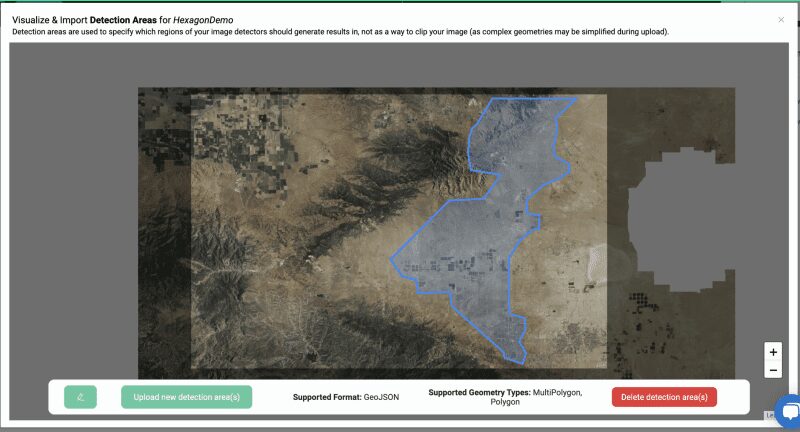
We chose the following region. It includes the area covered by both solar panels as well as wind farms, (we will have another demo showcasing wind turbine detection in the region). It wasn’t necessary to have the detection area cover the wind energy farm region for the solar panel detection but it does make for a better demonstration of applying our solar panel detector over a larger area (at scale) so we left it as is.
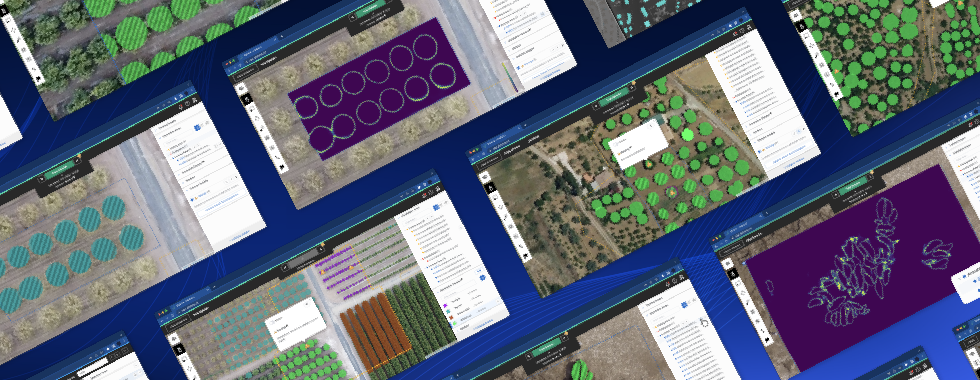
Next, all we have to do is run our trained solar panel detector with a click of a button and wait for our results which look something like this:
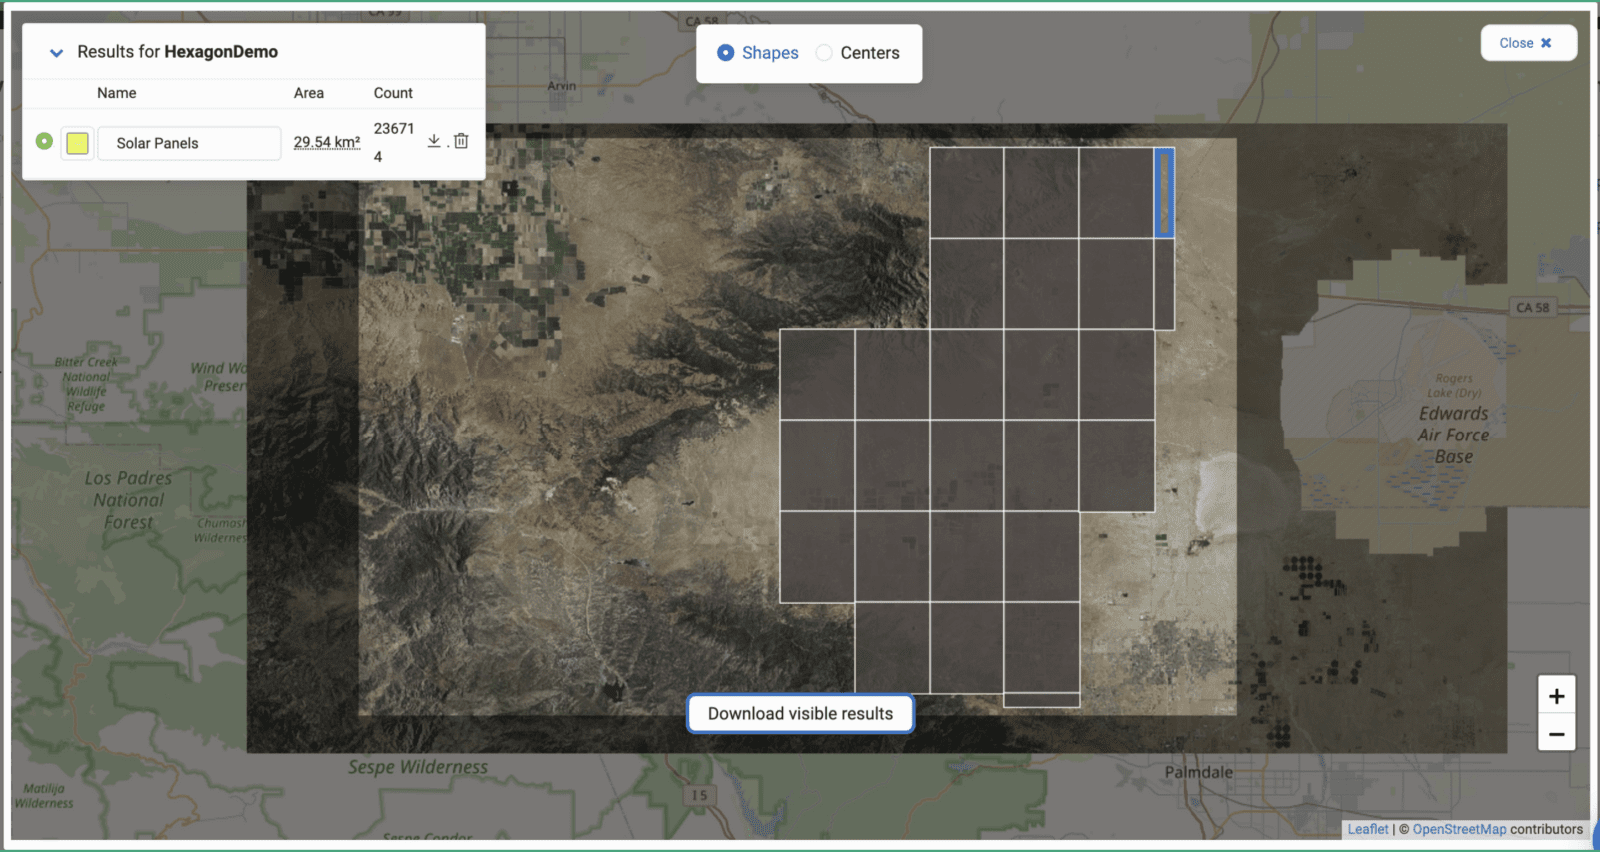
Detection Cells over a large region of detections
Why all the boxes? It’s more of a technical detail but because this is an extremely large region we divide the detection up into separate “detection cells”. This allows smoother visualisation of your results as showing everything at once might slow down your browser. It also makes it easy to show incremental progress on your detection job as well as gives it some more robustness to failure on the server side, all considerations that need to be accounted for when dealing with large scale projects on geospatial imagery. Let’s look at the actual detections now.
On Picterra, you can click on one of the cells to view results.
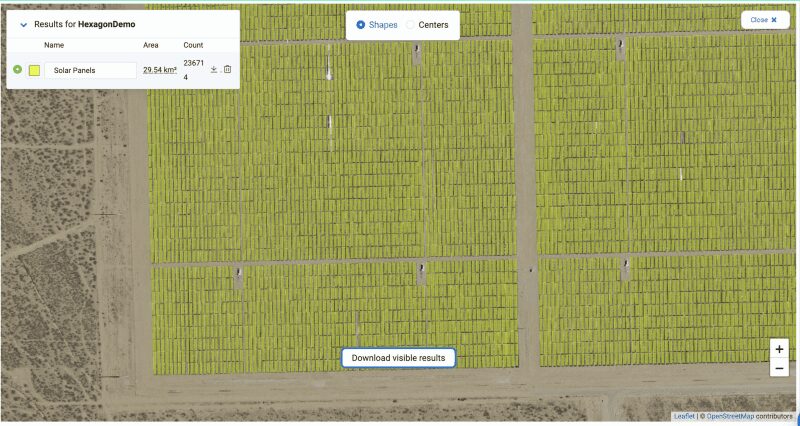
Zooming in, we see the actual individual detections over the solar panel arrays.
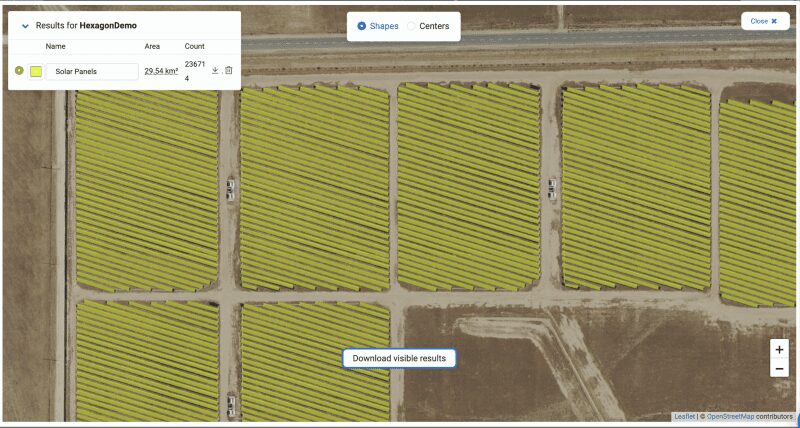
It even works perfectly for the diagonal solar panels.
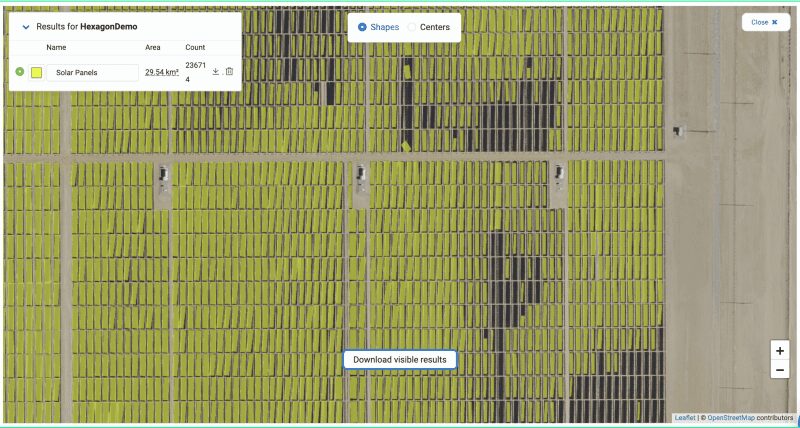
There was one region where the detector missed few chunks.
Let’s touch on this last image here. The detector clearly didn’t do as well in this spot. This is probably because we need to add a few annotations of solar panels look like these ones (not all panels look the same). This can easily be fixed just by adding 5 to 10 annotations of these solar panels to the detector training and this just clicking “Train Detector”, which in total should take only about 5 minutes, after which the detector will have better learned what these panels that it missed look like. Part of the beauty of the Picterra workflow is that it’s an iterative process. You always have the freedom to extend and improve your detectors over time, they are not fixed entities. Machine Learning is an extremely flexible tool, but in order to use it effectively you need a platform that can actually provide you with the options to utilise that flexibility and evolve your solutions as you see fit. This is core idea behind the Picterra platform. After applying the above fixes and running the detection over this area again, we get:
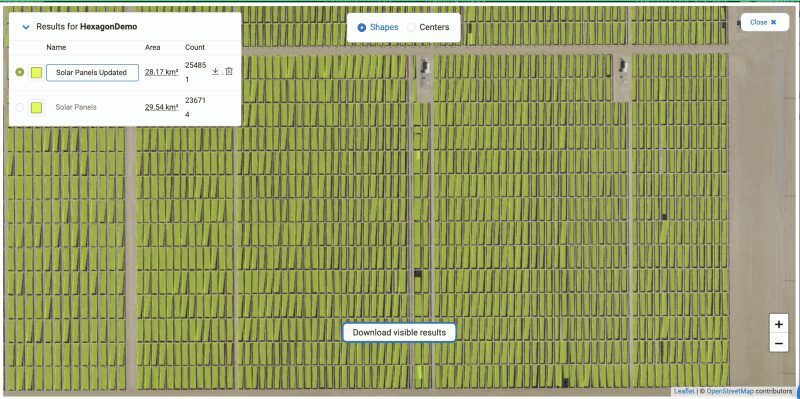
Much better!
Renewable Energy Monitoring: Final words
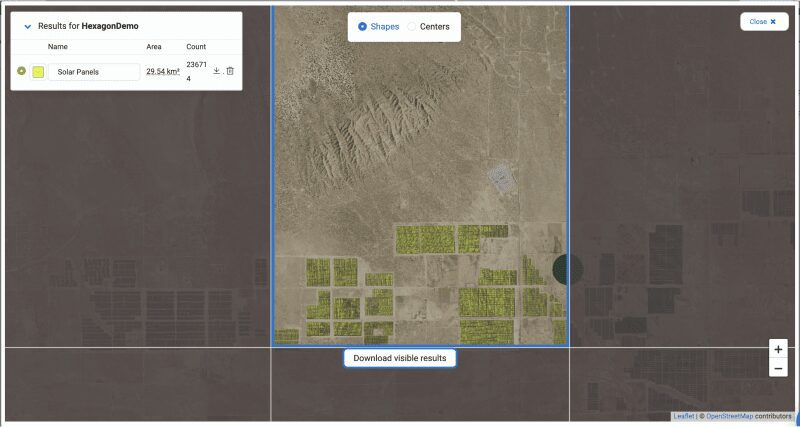
All in all, we counted about 24000 solar panels (granted the definition of what counts as a solar panel here is a bit loose). We also mapped almost 30 sq km of solar panel area across this 5000 sq km region. You can export these detections as various vector file formats to use in your own workflows or you can generate a report from the Picterra UI to present or share with others. Here’s a more birds eye view of the detections:
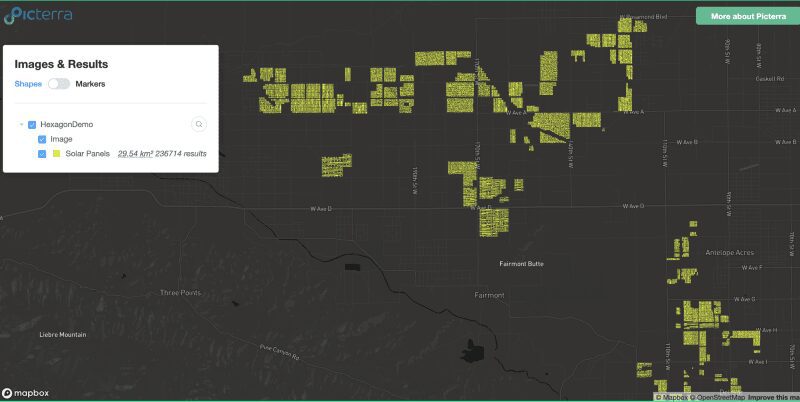
Detections visualized in a Polygon Web Report (generated from the Picterra platform). We hid the image underneath to let you see the solar farm regions more clearly here.
Remember that this 5000 sq km area is just a small portion of the imagery Hexagon has to offer and only one use case out of an infinity that you can build using Picterra’s machine learning platform. Hexagon also does yearly updates of all of their imagery so you can be sure that the imagery you use will be relatively up to date. Hexagon is just one example of an aerial imagery provider. In fact you can even get some free aerial and drone imagery from Open Aerial Map, We expect many more aerial imagery sources become more accessible in the future and we at Picterra will continue to try to make it as easy as possible to access, process and glean insights from this data directly from our platform!
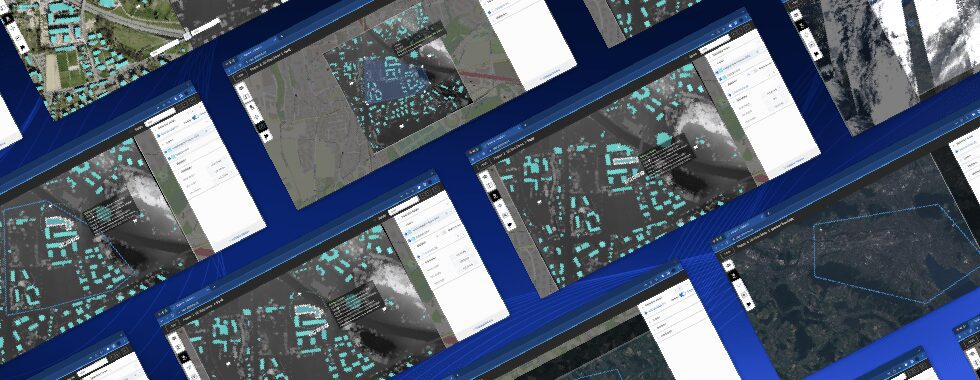
Bonus: Wind Turbines
Here are some screenshots of detections of wind turbines (both large and small) in the same region, still using Picterra and Hexagon’s aerial imagery!
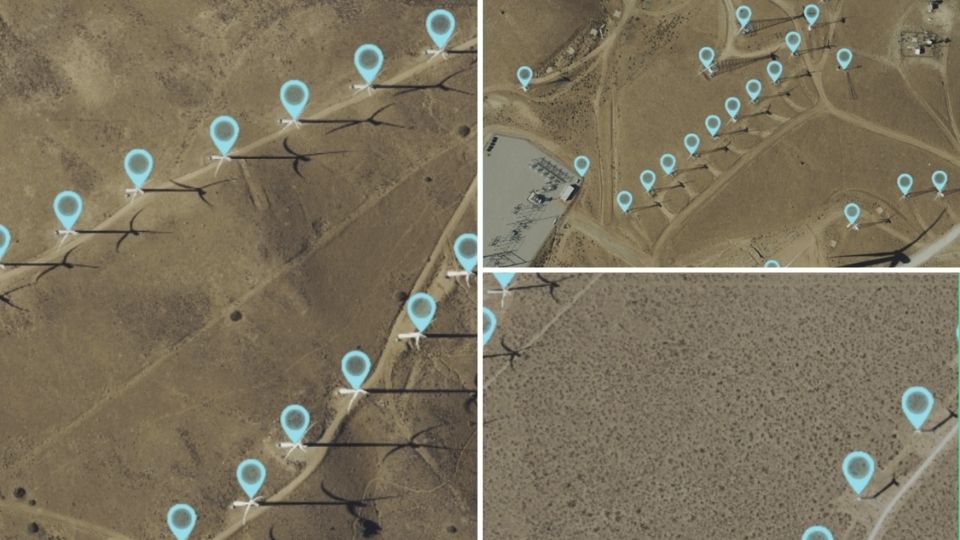
Wind Turbine detections of different types and sizes (in this case using the same detector, though you could also train separate detectors to specialise in detecting different types of wind turbines)