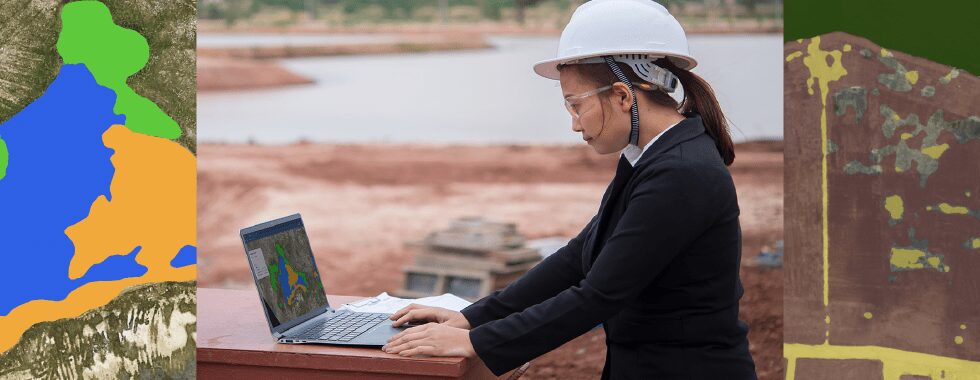
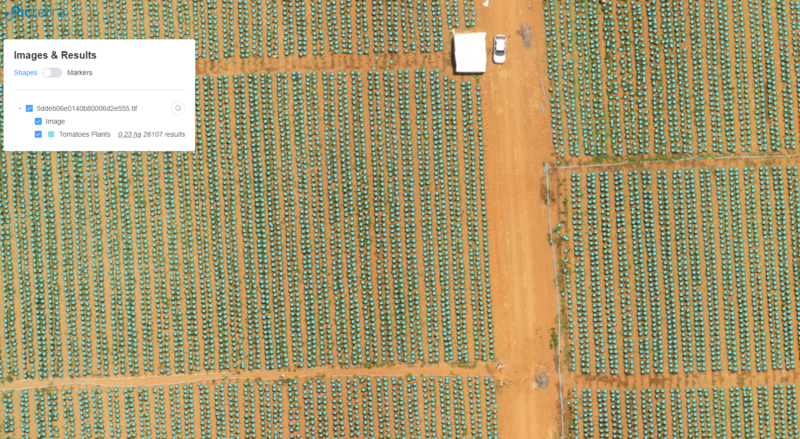
There are many reasons to count plants. It gives the view of the field and allows spotting difficulties in order to react as fast as possible. However, conducting manual count is particularly tedious, time-consuming, and prone to errors. If you need to monitor the number of plants regularly, manual methods are completely inefficient. Picterra solves this issue. Below you can find an example of the detector that counts tomatoes that was built and trained in less than an hour. You can also access the project and see the results directly on our platform.
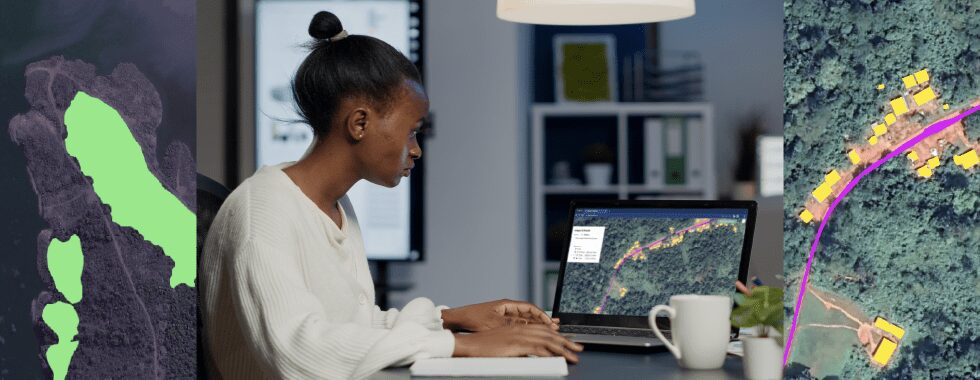
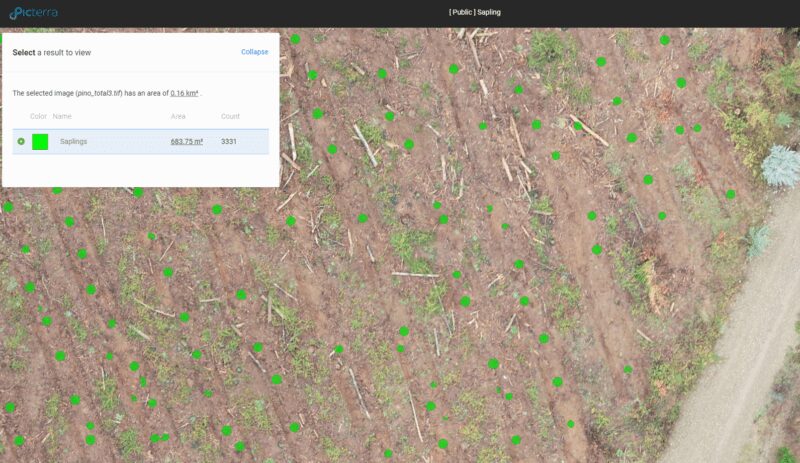
Detecting and counting saplings is another interesting example of using Picterra in agriculture. These tiny young trees are particularly tricky to spot manually on the image because, as you can see in the screenshot below, they’re hard to differentiate from other plants. With Picterra, you only need to annotate a few examples and counterexamples to teach the model how a sapling looks.
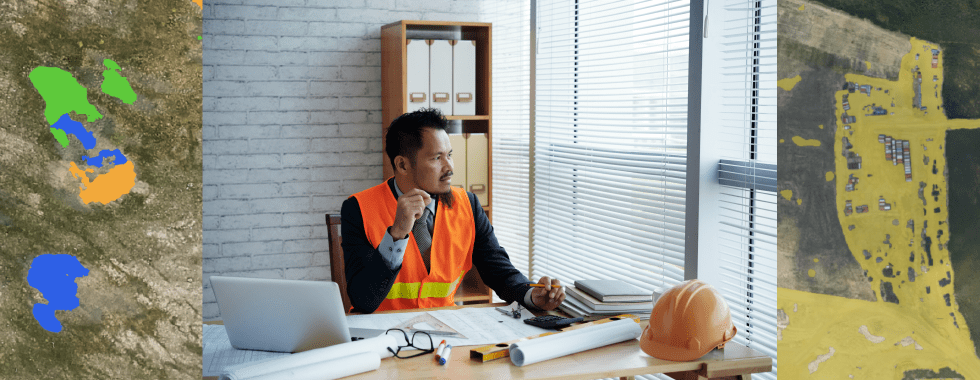
On Picterra, you can detect not only plants but also gaps between them, which is an important indicator of planting quality. It’s challenging to avoid gaps completely – they’re caused by various factors, such as local erosion, pests, heavy machines, and so on. However, analyzing drone imagery make it possible to fill these gaps in the most efficient way. Check this article to read more about detecting gaps in sugarcane crops.
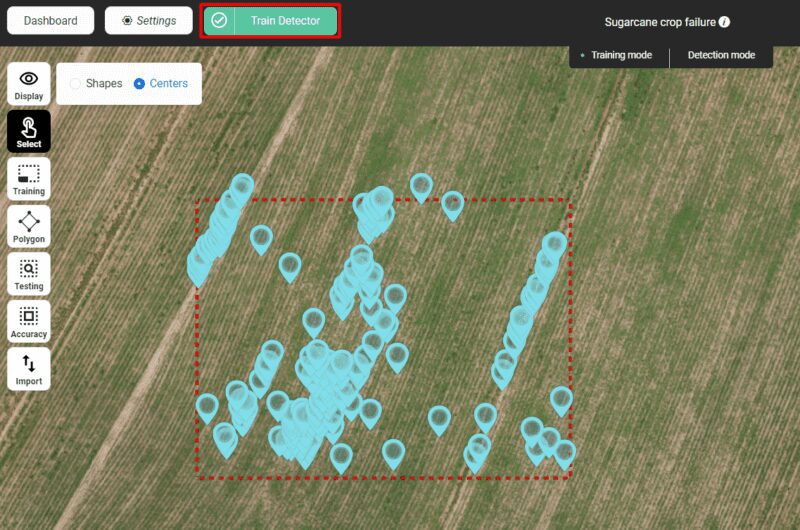
The results of detecting sugarcane gaps on the Picterra platform. Image copyright: Indshine.
Weeds and invasive species are a significant threat to agriculture in terms of productivity and sustainability. They often grow quickly, aggressively compete with the crop and quickly transfer from one field to another. What makes things worse, weeds tend to introduce bacteria and fungi, causing the grower a decrease in harvest yield and income. That’s why it’s crucial to detect them as early as possible to get them efficiently removed from the field. We have already described how an American grower handled this issue with very good results, so check this article about Shuttercane detection to learn more about it.
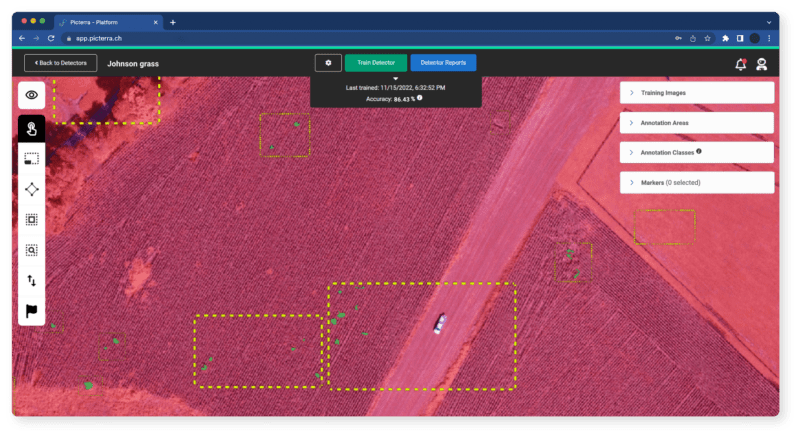
Custom detector for weed detection built on Picterra.