Editing and managing your Picterra results in your own GIS Software
Picterra results are exported into standard formats, such as GeoJSON, Shapefile, KML, CSV, that can be read with virtually any GIS platform that you are using.
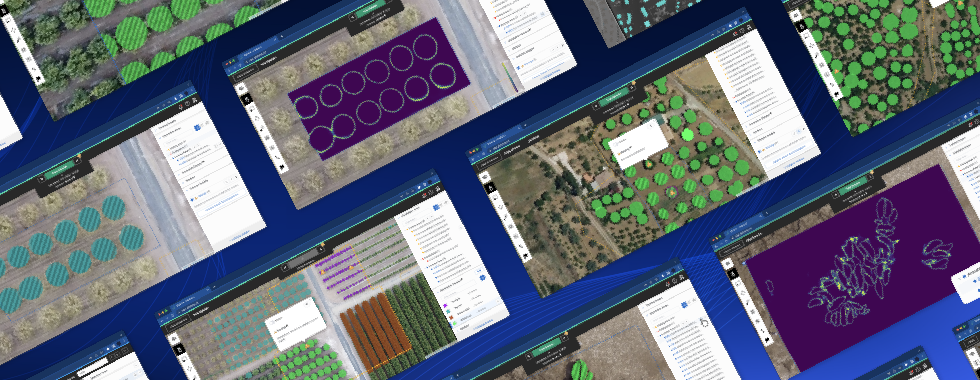
Here are just a few examples of projects where our users have done post-processing in ArcGIS:
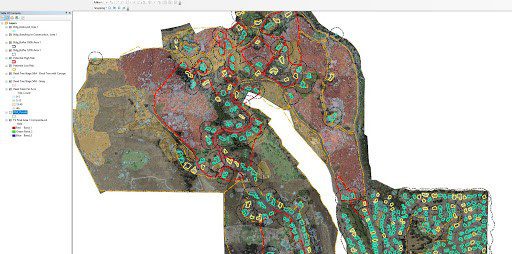
Picterra shapefile output merged with property data, slope analysis & encroachment buffers using ESRI ArcGIS.
Connecting to your image server
One of the best ways to deal with very large images in Picterra is to import them via web services. We currently support 3 standards of web image services: WMS / WMTS / XYZ.
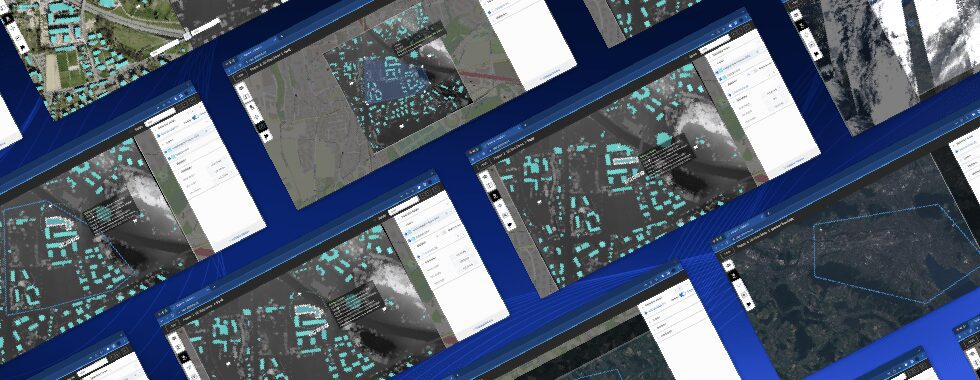
Have a look at some examples of projects using web image services:
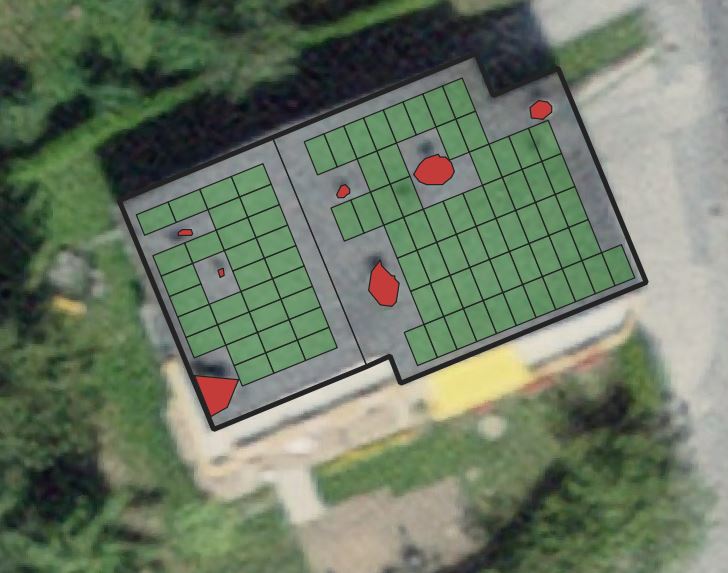
Data analysis supporting installing photovoltaic panels in Switzerland.
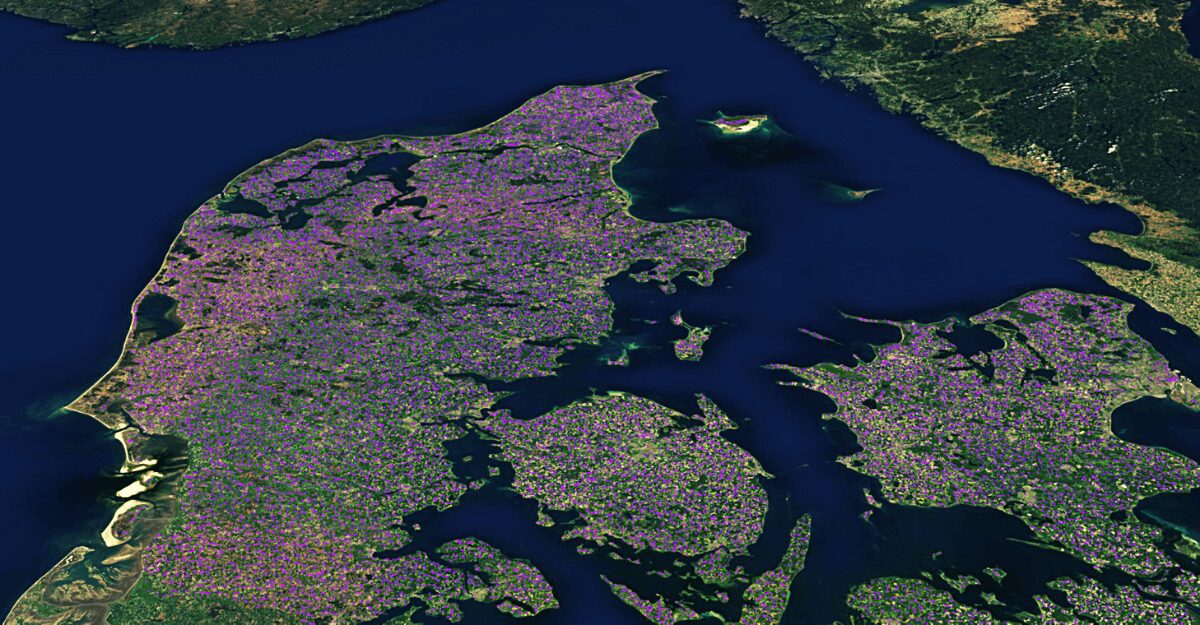
Detecting 26.000 objects on a WMS imagery of Denmark in a few hours.
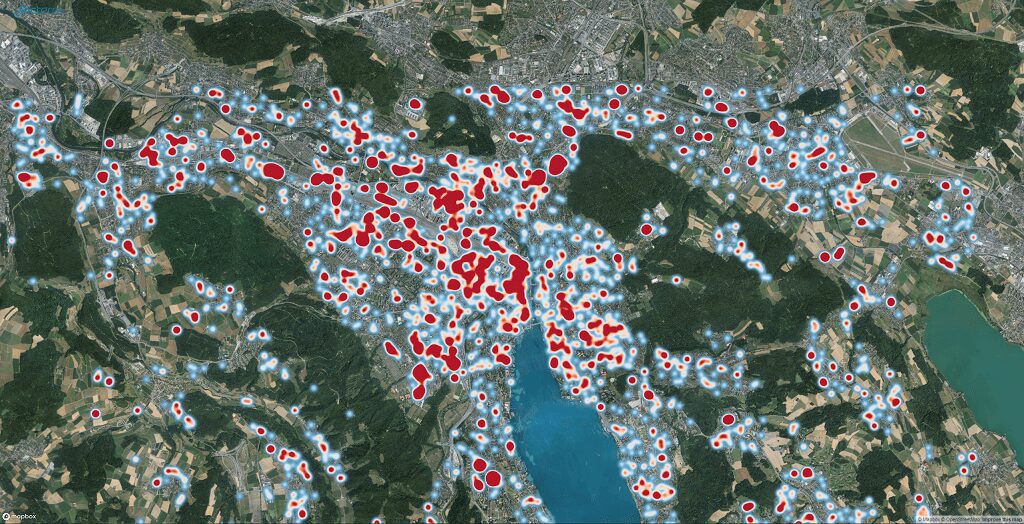
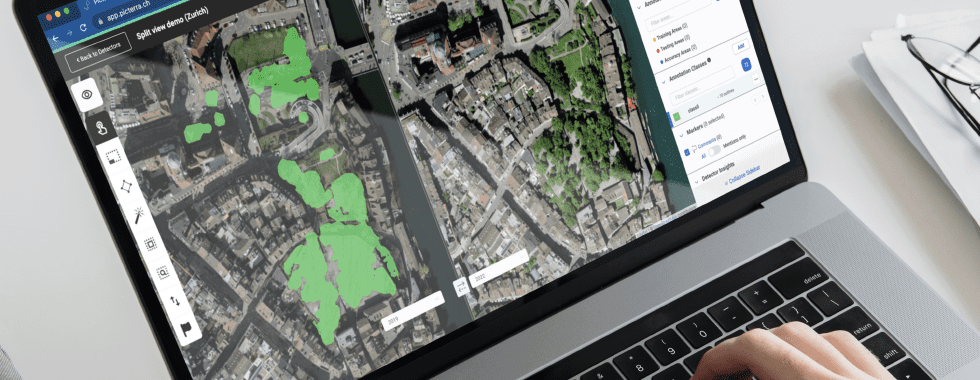
A heatmap showing solar panels detected over Zurich, Switzerland
Solar panel monitoring at a scale
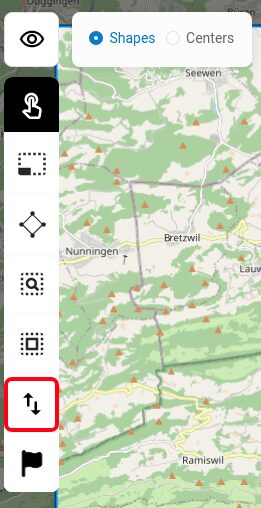
How to connect to your image server:
- Open a Project.
- Under the ‘Add Imagery’ menu, select ‘Online Map Imagery’.
- In the list at the top of the screen, select the ‘Connect New Imagery Server’ Option.